Fabricate+
“A exhaustive optimization system for fabrication”
“Fabricate+” creates a platform for construction management and fabrication optimization.
Created Rhino(3D model) based add-on as a user interface which allows designers to create initial design sketches, using Grasshopper(Open Source Framework).
Built Python scripts in Grasshopper to transfer design sketches into 3D models & 2D construction drawings.
Developed data streaming service using Flux(web service) to handle cross-platform connection.
Implemented Genetic Algorithms using Galapagos(open source framework) to find optimal design solutions in a large amount of variations
Objective
The objective is to create data streaming service that enable cross-platforms connection.

Overview
1. Unit:
Grasshopper and other script platforms doesn’t have unit recognition system built in. So before setting up a definition within Rhino, be sure to use an appropriate unit such as inch/mm and keep all following operation unit consistent.
2. Original Point:
When you start to design a new project, specially with the parametric tool like rhino-grasshopper, keep in mind that every geometry should be created from a start point. That’s the Original Point of our project.
In 120 Stockton, which is a rennovation project, we already have the original point set up in real world, so just pick the (0,0,0) in Rhino to represent that, we will introduce new original point when we get on other platforms like Revit. We will start from here.
3. Grids and Levels:
In Grasshopper, wWe could set up the Grids and Levels, using X-Z ![]() ,Y-Z
,Y-Z ![]() plane for Grids and X-Y
plane for Grids and X-Y ![]() plane for Levels to create reference plane for all geometries.
plane for Levels to create reference plane for all geometries.
4. Parameters:
Since all geometries are created from Original Point and related Parameters, the best practice of parametric design is using less numbers to generate more geometries. Always try to share Parameters when generating new geometries. By applying this method as much as possible, changing design in the increasing complexity procedure won’t become as same complicated.
Rhino-Grasshopper
△----------1. Framing —△2. Detailing—△------------------------------2. Detailing---------------------------3. Transporting—△-------------4. Analyzing-------
△Rhino+Grasshopper Workflow
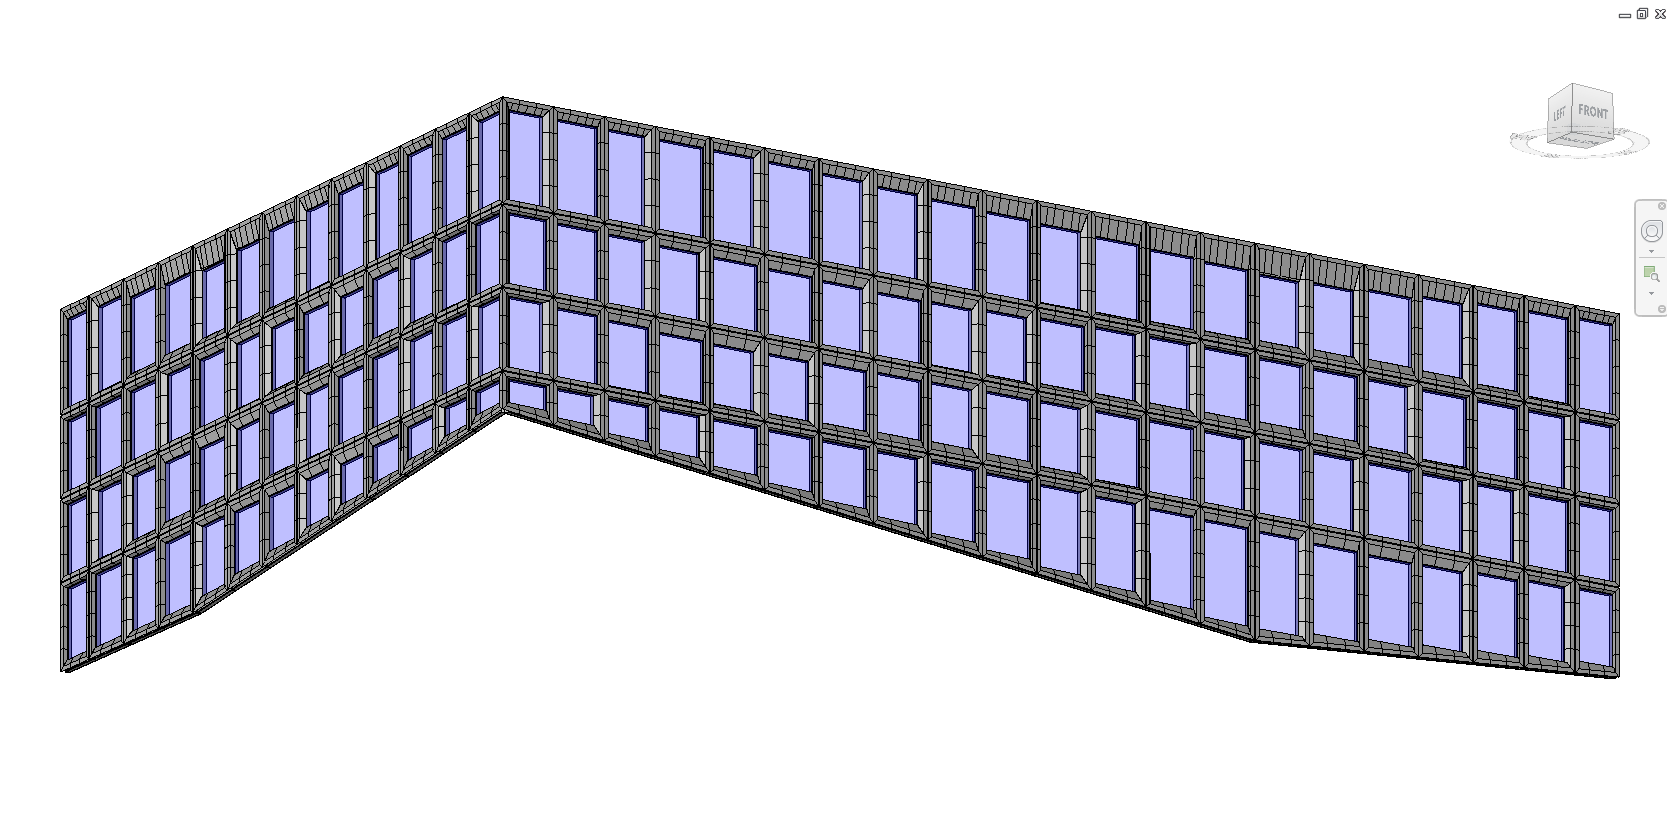
1. Framing
With all above set up and kept in mind, we could start constructing our definition. First of all, we will construct the frame of model from our Schematic Design phase. Generally, parametric 3d modeling process could described as the diagram below:

△Original Points:
△Reference lines:
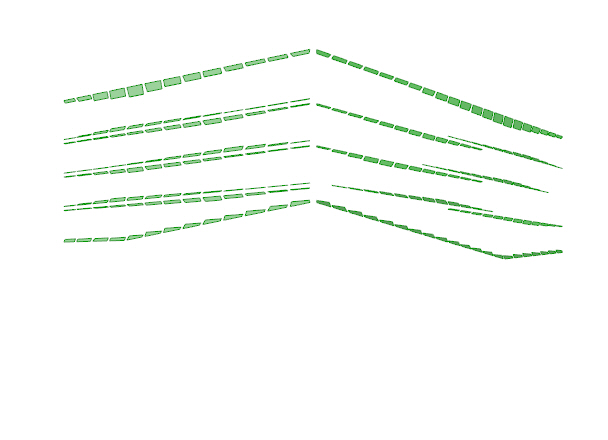
△Preliminary Surfaces:
△Subdivided Surfaces
△Offset boundaries to obtain a derived surface
△Offset boundaries to obtain a derived surface
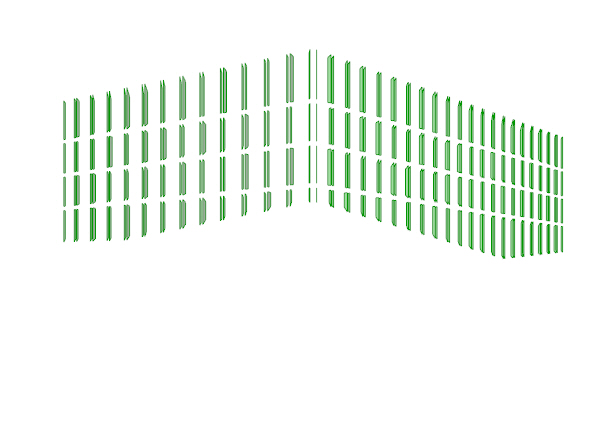
△Select portion of entities in a designed pattern with Random/Genetic algorithm
△Constructing new preliminary surfaces
△Generate new preliminary surface attracted by curves
△Constructing Attractor Curves
△Generate new preliminary surface attracted
△Modify the attractor curves
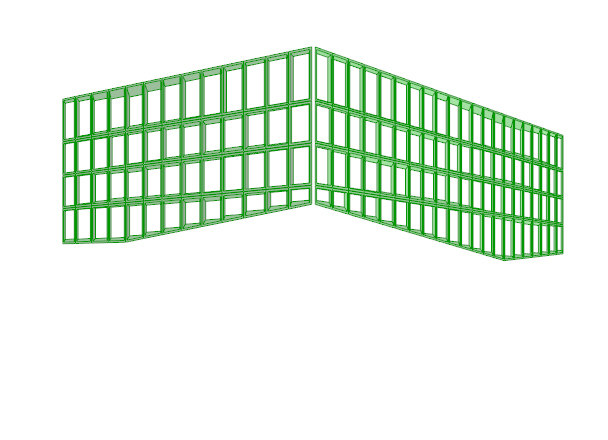
△Generating sub-surfaces.
△Generating the final poly-surfaces by combining sub-surfaces
2. Detailing
Once the framing model has been created, we could start further detailing the model, in the example, subdividing the Ppolysrf. This step is critical in three aspects:
- Visualizing the full design intent in early phase, in order to verify the detail from aesthetic perspective before documenting.
- Preparing adaptive points for transporting 3D geometry to other platforms such as Revit+Dynamo.
- Establishing initial data flow, as the object for Analyzing and Optimizing
After all, the detailing step is the most important step to Realize the design concept by connecting Generic Model with Material and Manufacturinge in the real world.
△Subdivideing the polysrf with material constraints.
△Extracting critical points that describe the geometry, simplify the points data structure for transporting
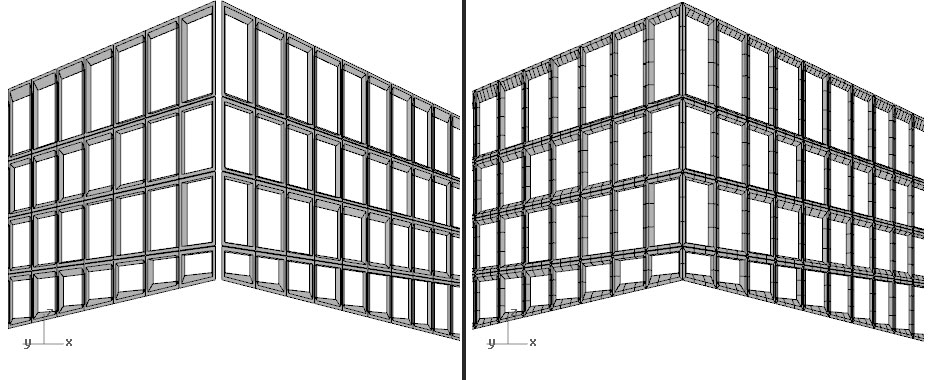
△Visualizeing the division
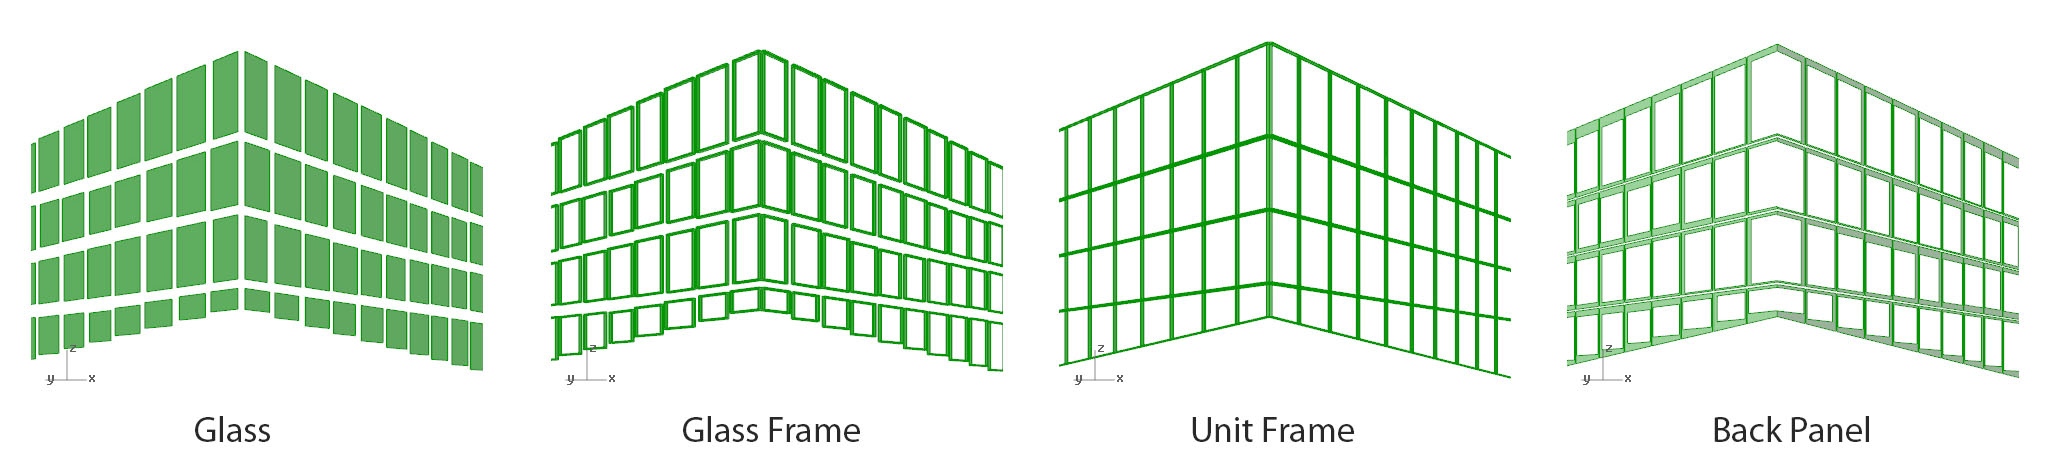
△Constructing other depending entities in the wall type system.
△Again, extracting critical points that describe these entities, simplify the data structure for transporting.
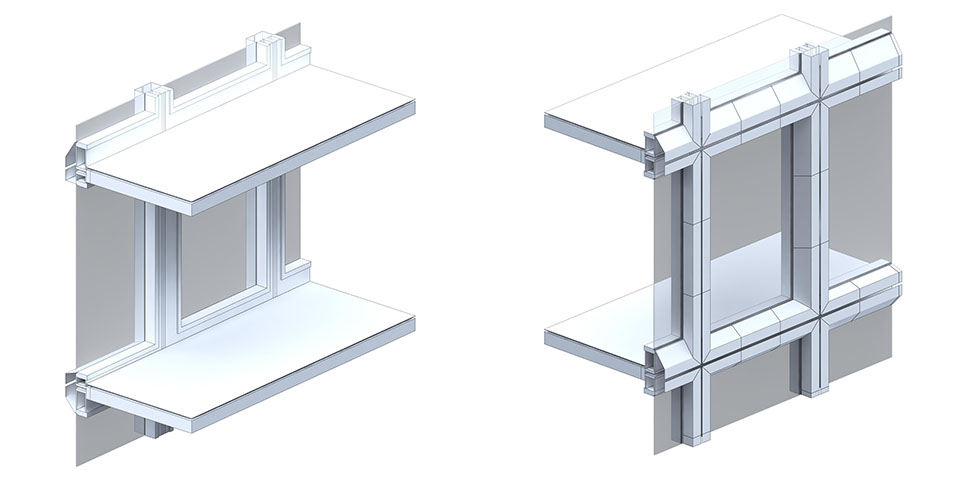
△Review the section of integrated model
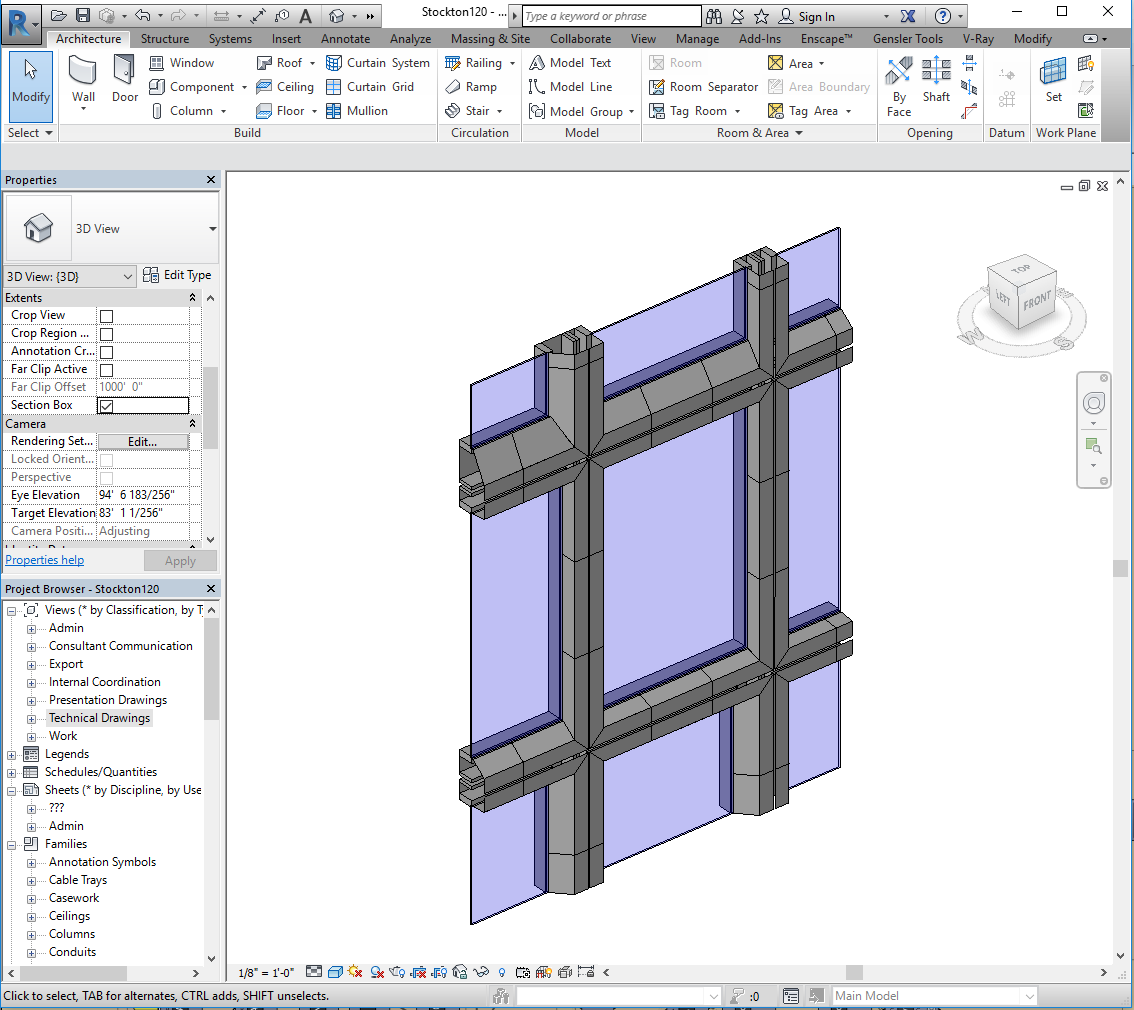
3. Transporting
Next step, data stream from Rhino+GH get processed and drained to other platforms, in this example, we used flux.io as the media to transport data, pushing it to Revit+Dynamo. Specifically, those Points Coordinates got exported and imported into Dynamo, rebuilding the geometry by using Adaptive-Components-by-Points.
Flux.io has already retired, in the future, alternative should be applied. However, the most practical way of transporting data between platforms is using Microsoft Office Excel.
Generally, the process could be summerized as:
- Collect prepared Points Coordinates in an appropriate data structure from last step, using
 Deconstruct Point component in Grasshopper.
 - Push the data by using
 WriteExcel component.
 - Receive stream data in Dynamo using Adaptive-Components-by-Points.
4. Analyzing
Without going too deep into the detail operation in Dynamo platform. We are going to start analyzing the feasibility/performance in developing design in previous steps.
Prior to jumping directly on complicated process and massive numbers. Let’s set the principal structure of analysis:
WHY: Why do we need analyze the design? One of the most important reason to apply parametric thinking in our design process is that we need examine the impact of our each action in achieving aesthetic and economic success. We have already shown in the previous parts how we review the design from aesthetic perspective. We will keep doing that. Here in this part, we will go through the process of monitoring our economic status.
HOW: In order to constantly monitor the economic aspect of design, we shall, first of all, establish the terminology for elements and systems we are going to study, thus we could talk in a consistent language. Secondly, set the specific goal of analysis. For example, How many pieces of terracotta panel do we need to composite the facade? or how many types of those do we need for a certain pattern?
WHAT:Results of analysis will become useful media for designers to prove the feasibility of design. Depending on the audience of this reporting, we could use different report formats to represent certain results. For example, color coded diagrams will give people a quick impression of the overall efficiency of a certain penalization strategy, while the schedule of quantity and kinds of terracotta pieces will show a precise conclusion of the economic status of design.
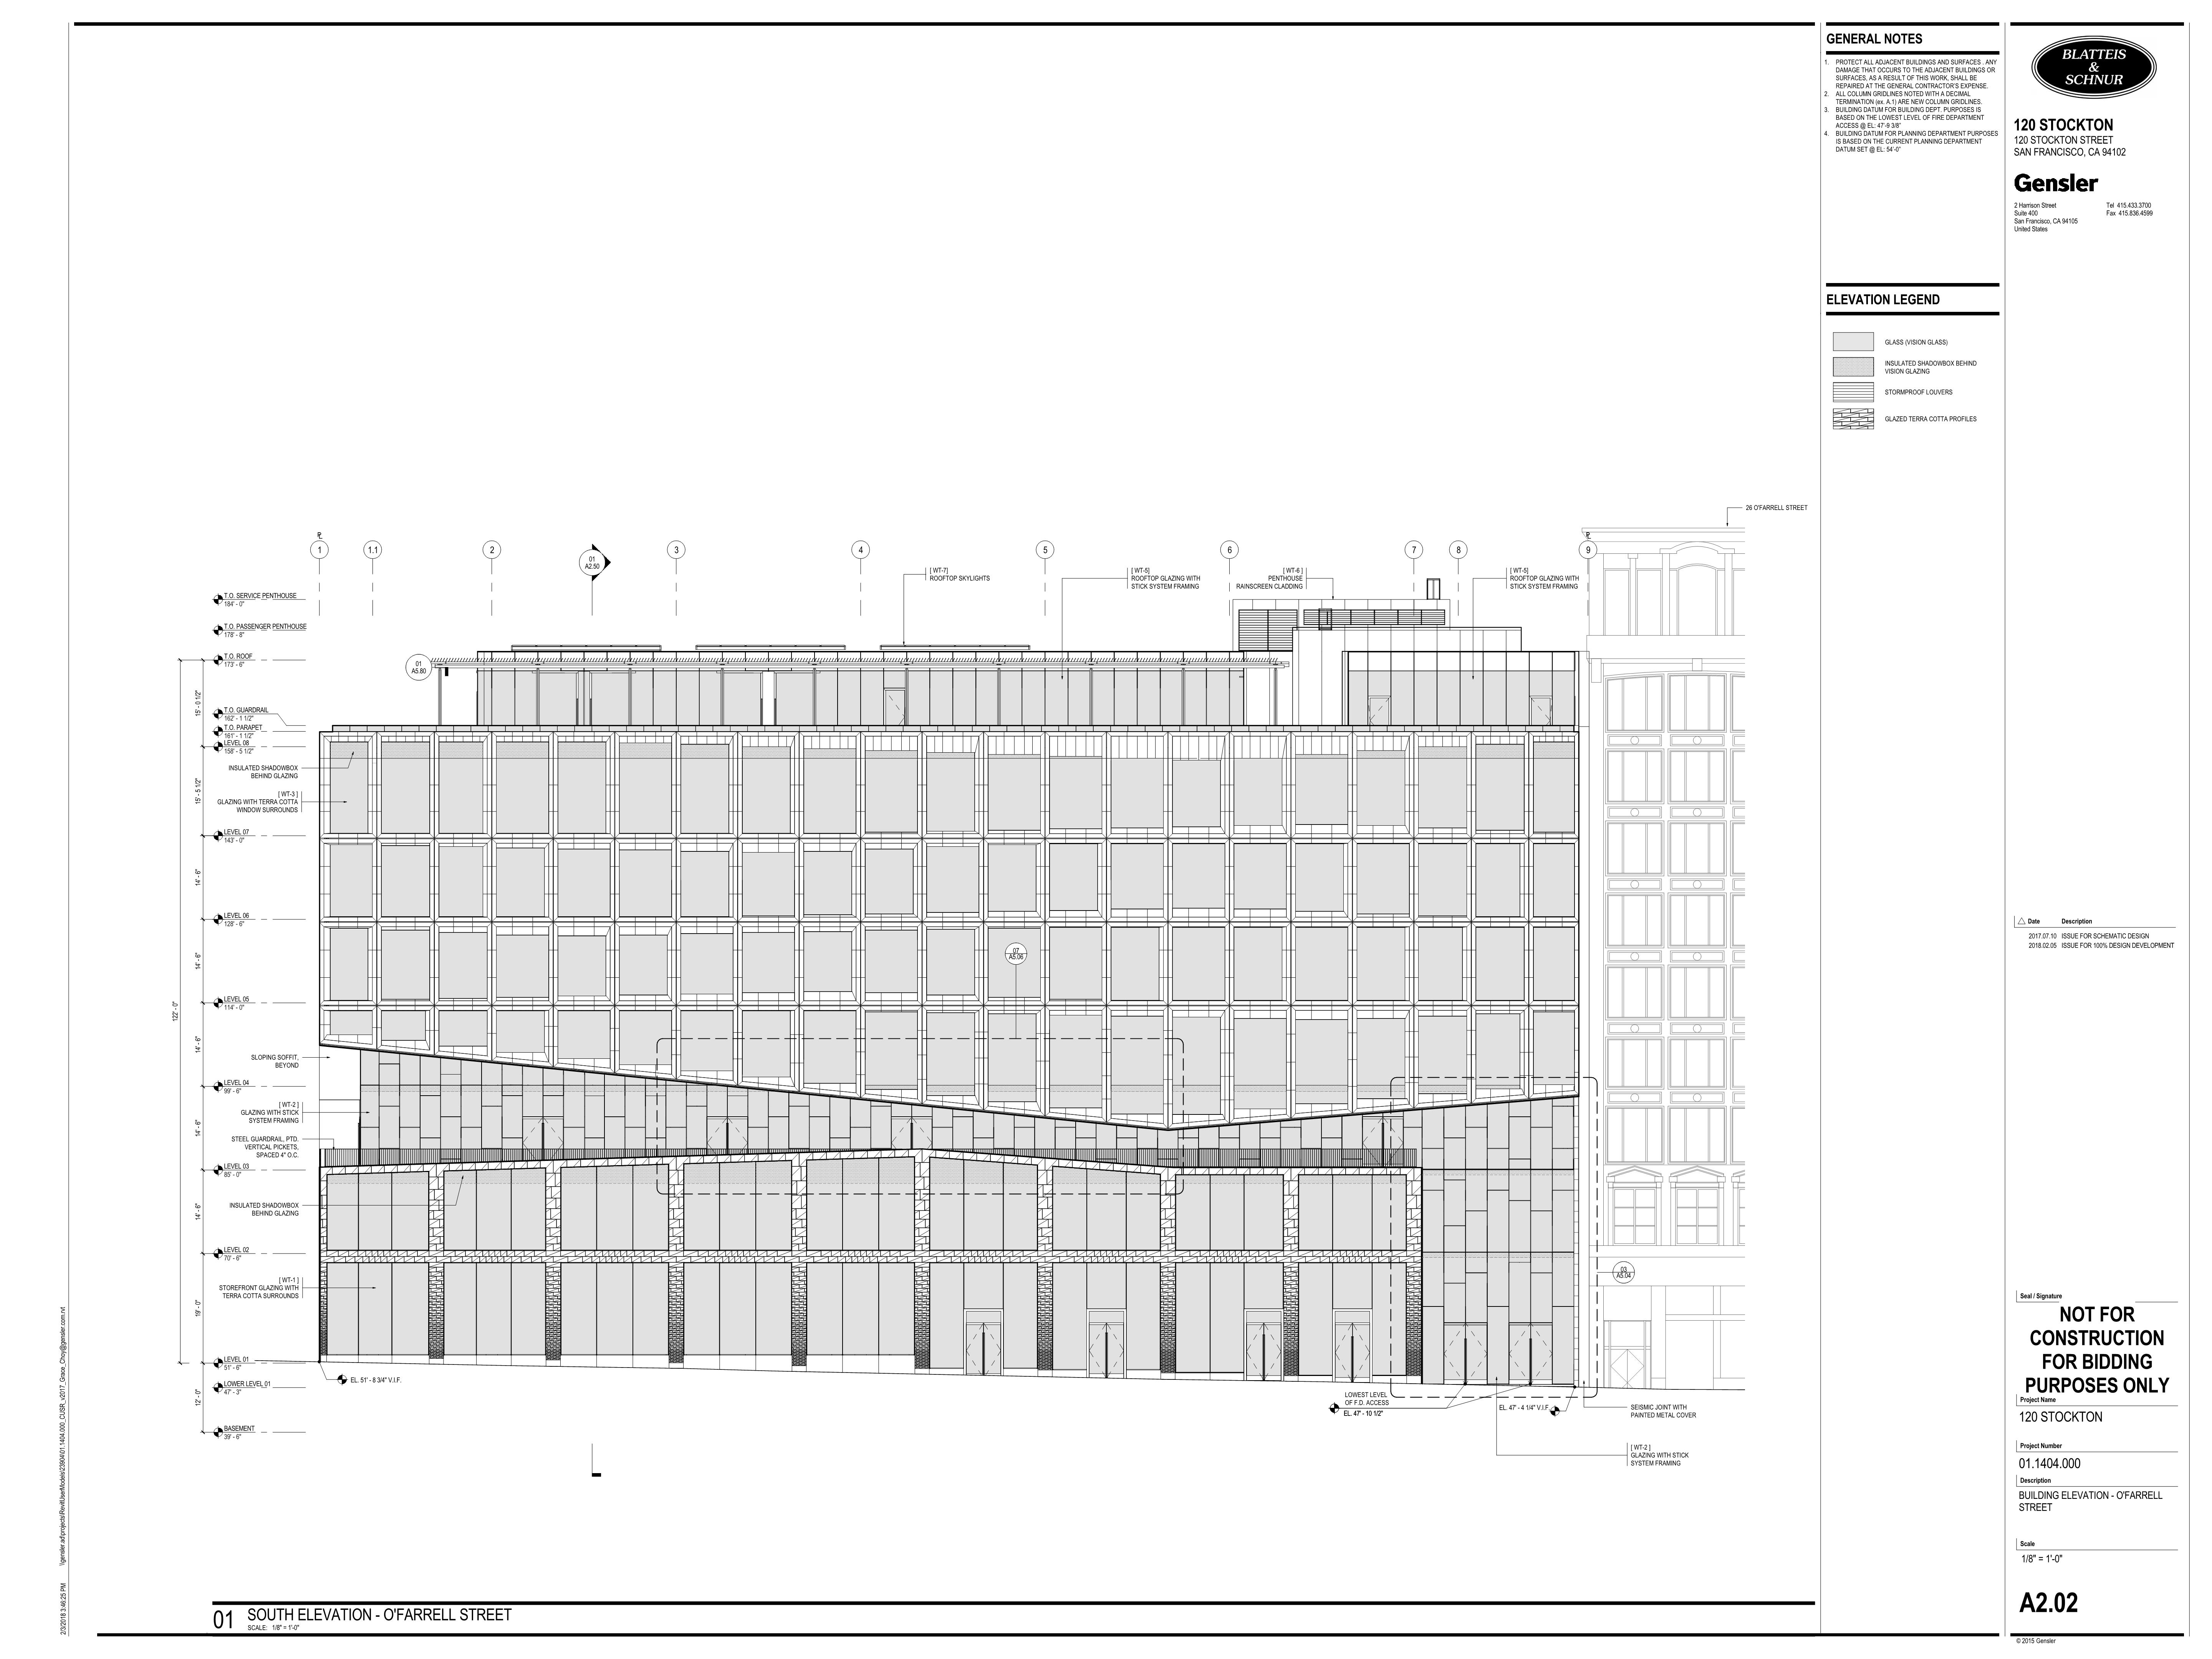
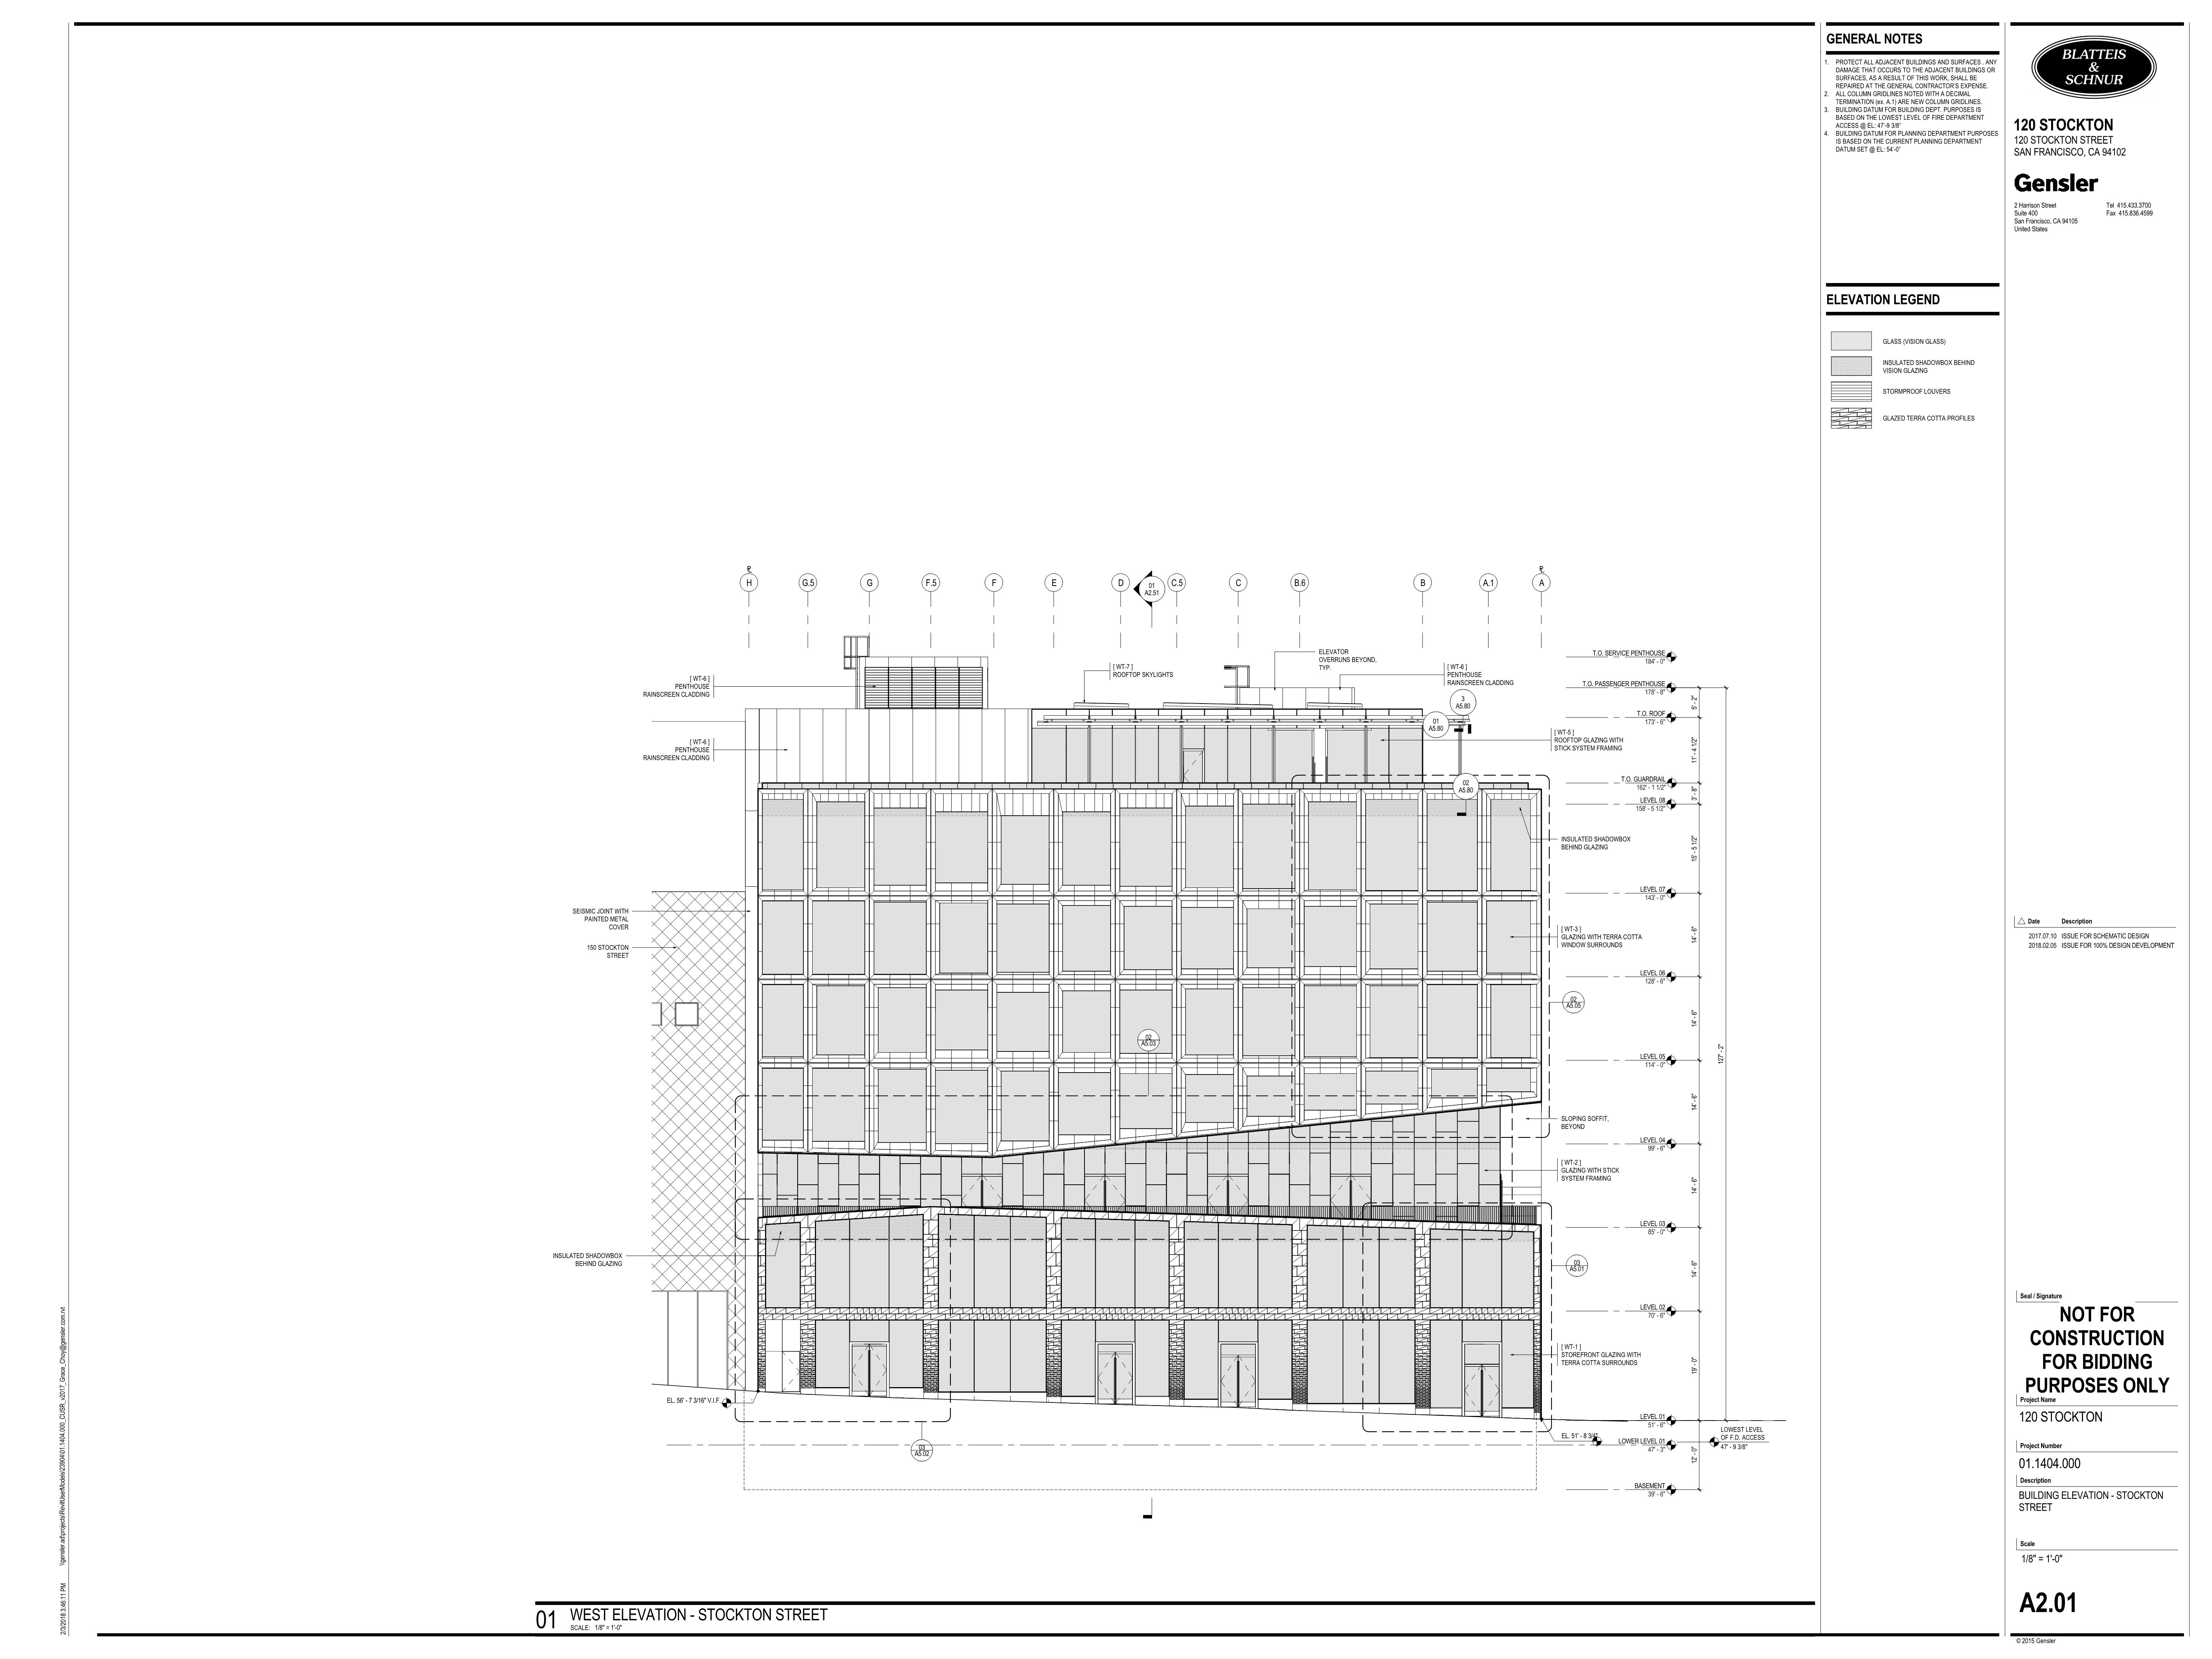
As following diagram indicate, we are examining the piece quantity and types for this terracotta facade. Let’s go through the process step by step, in the end, we will have several key numbers revealed, but understanding the way how we cooked is also important.
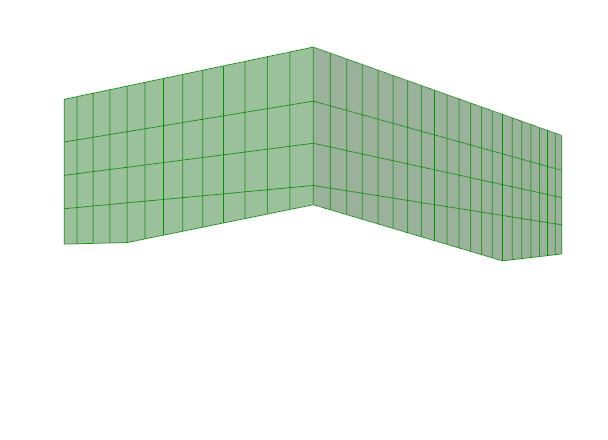
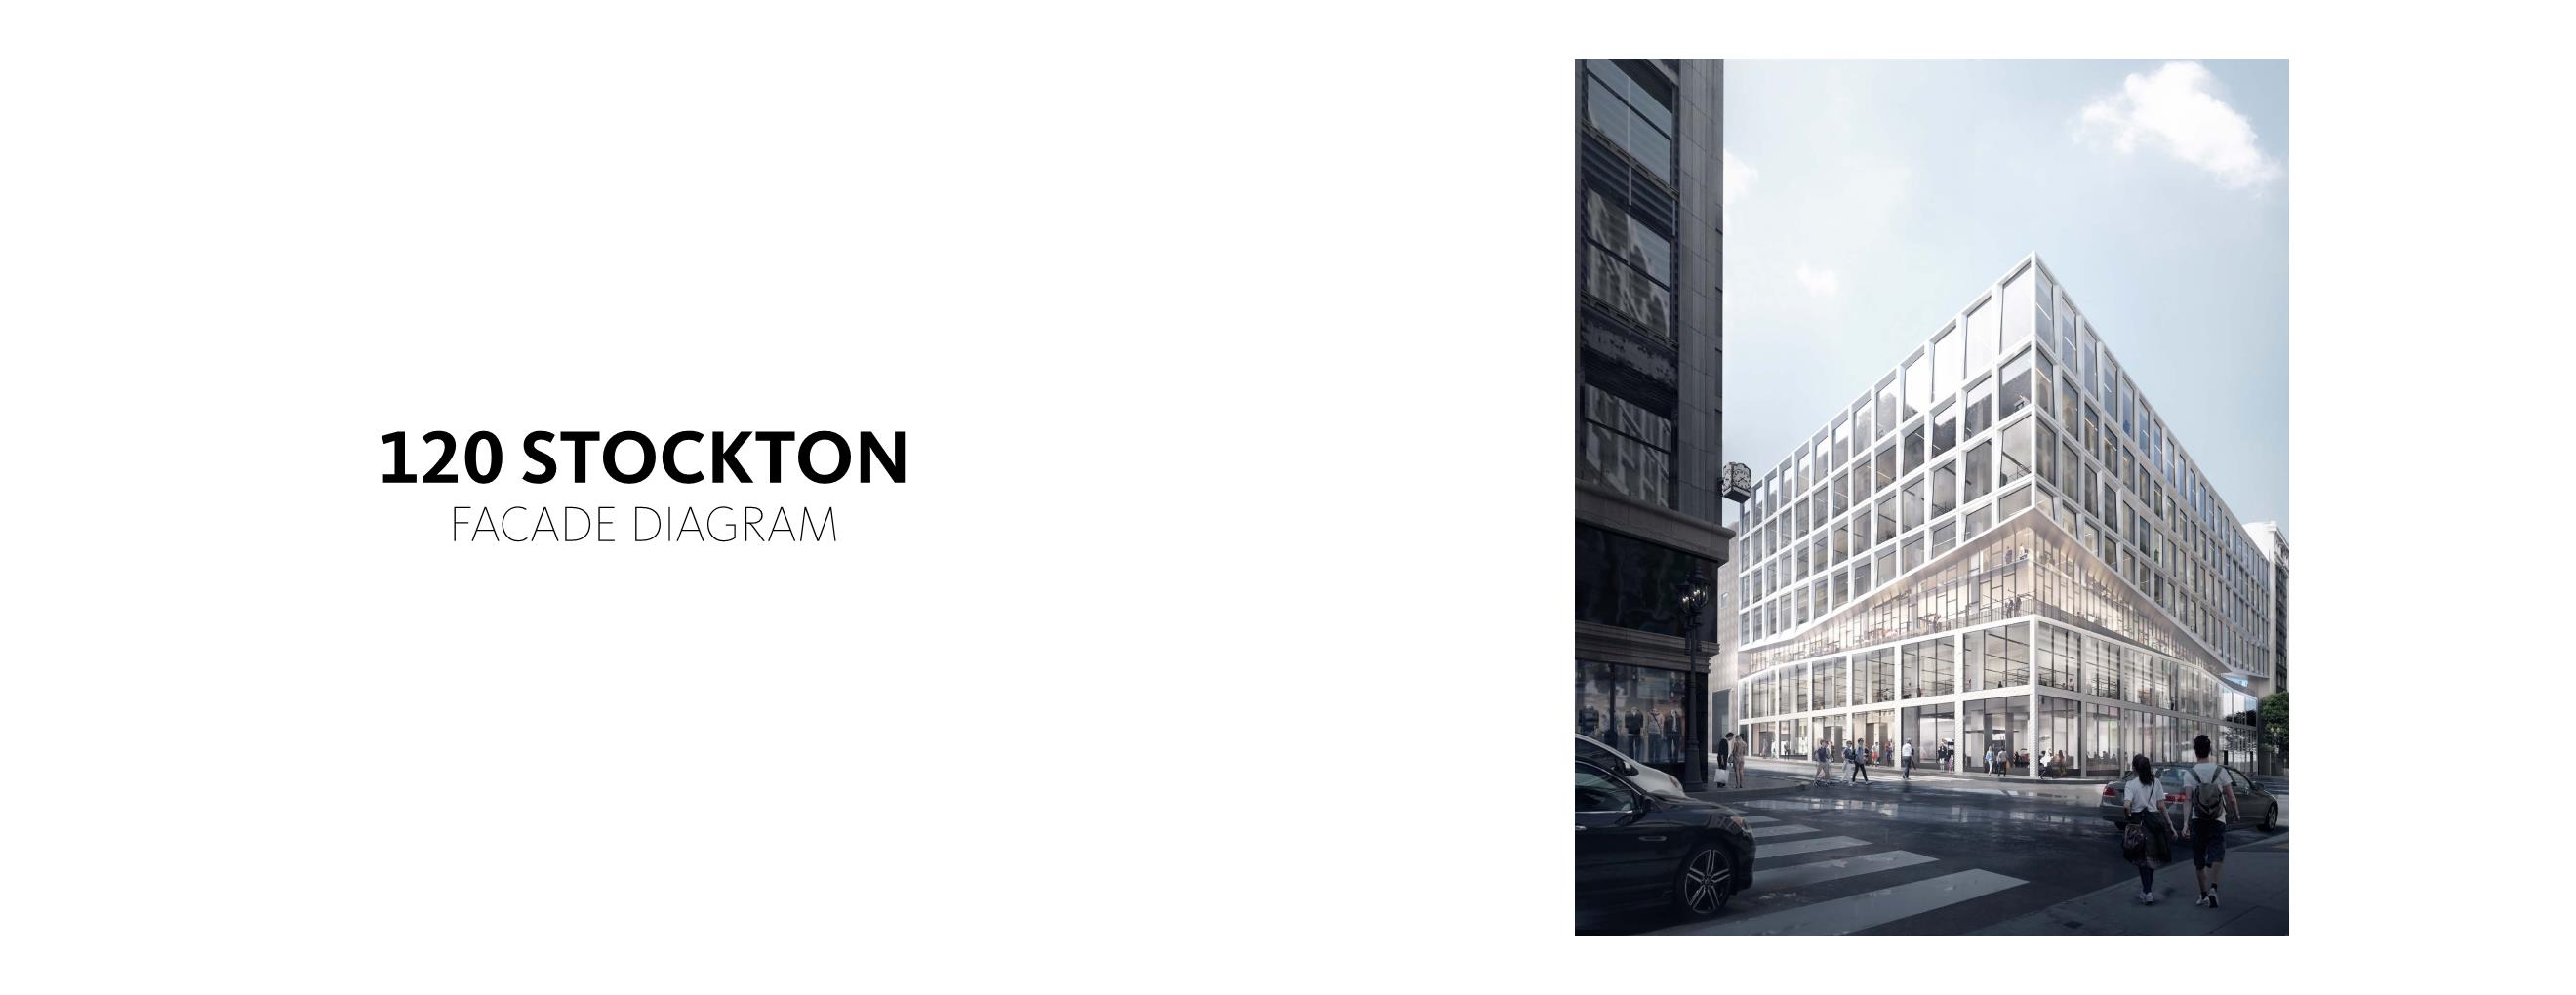 △1.Schematic Design Rendering
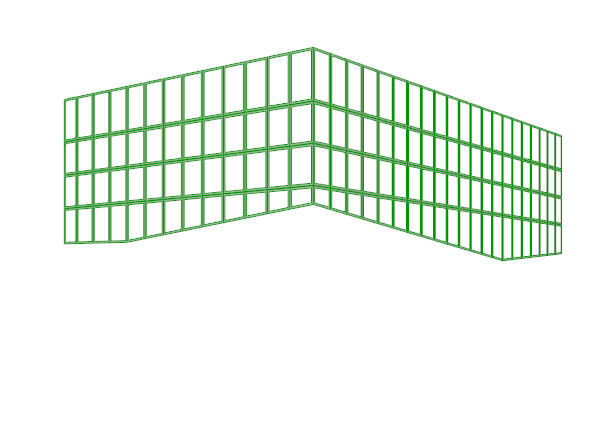
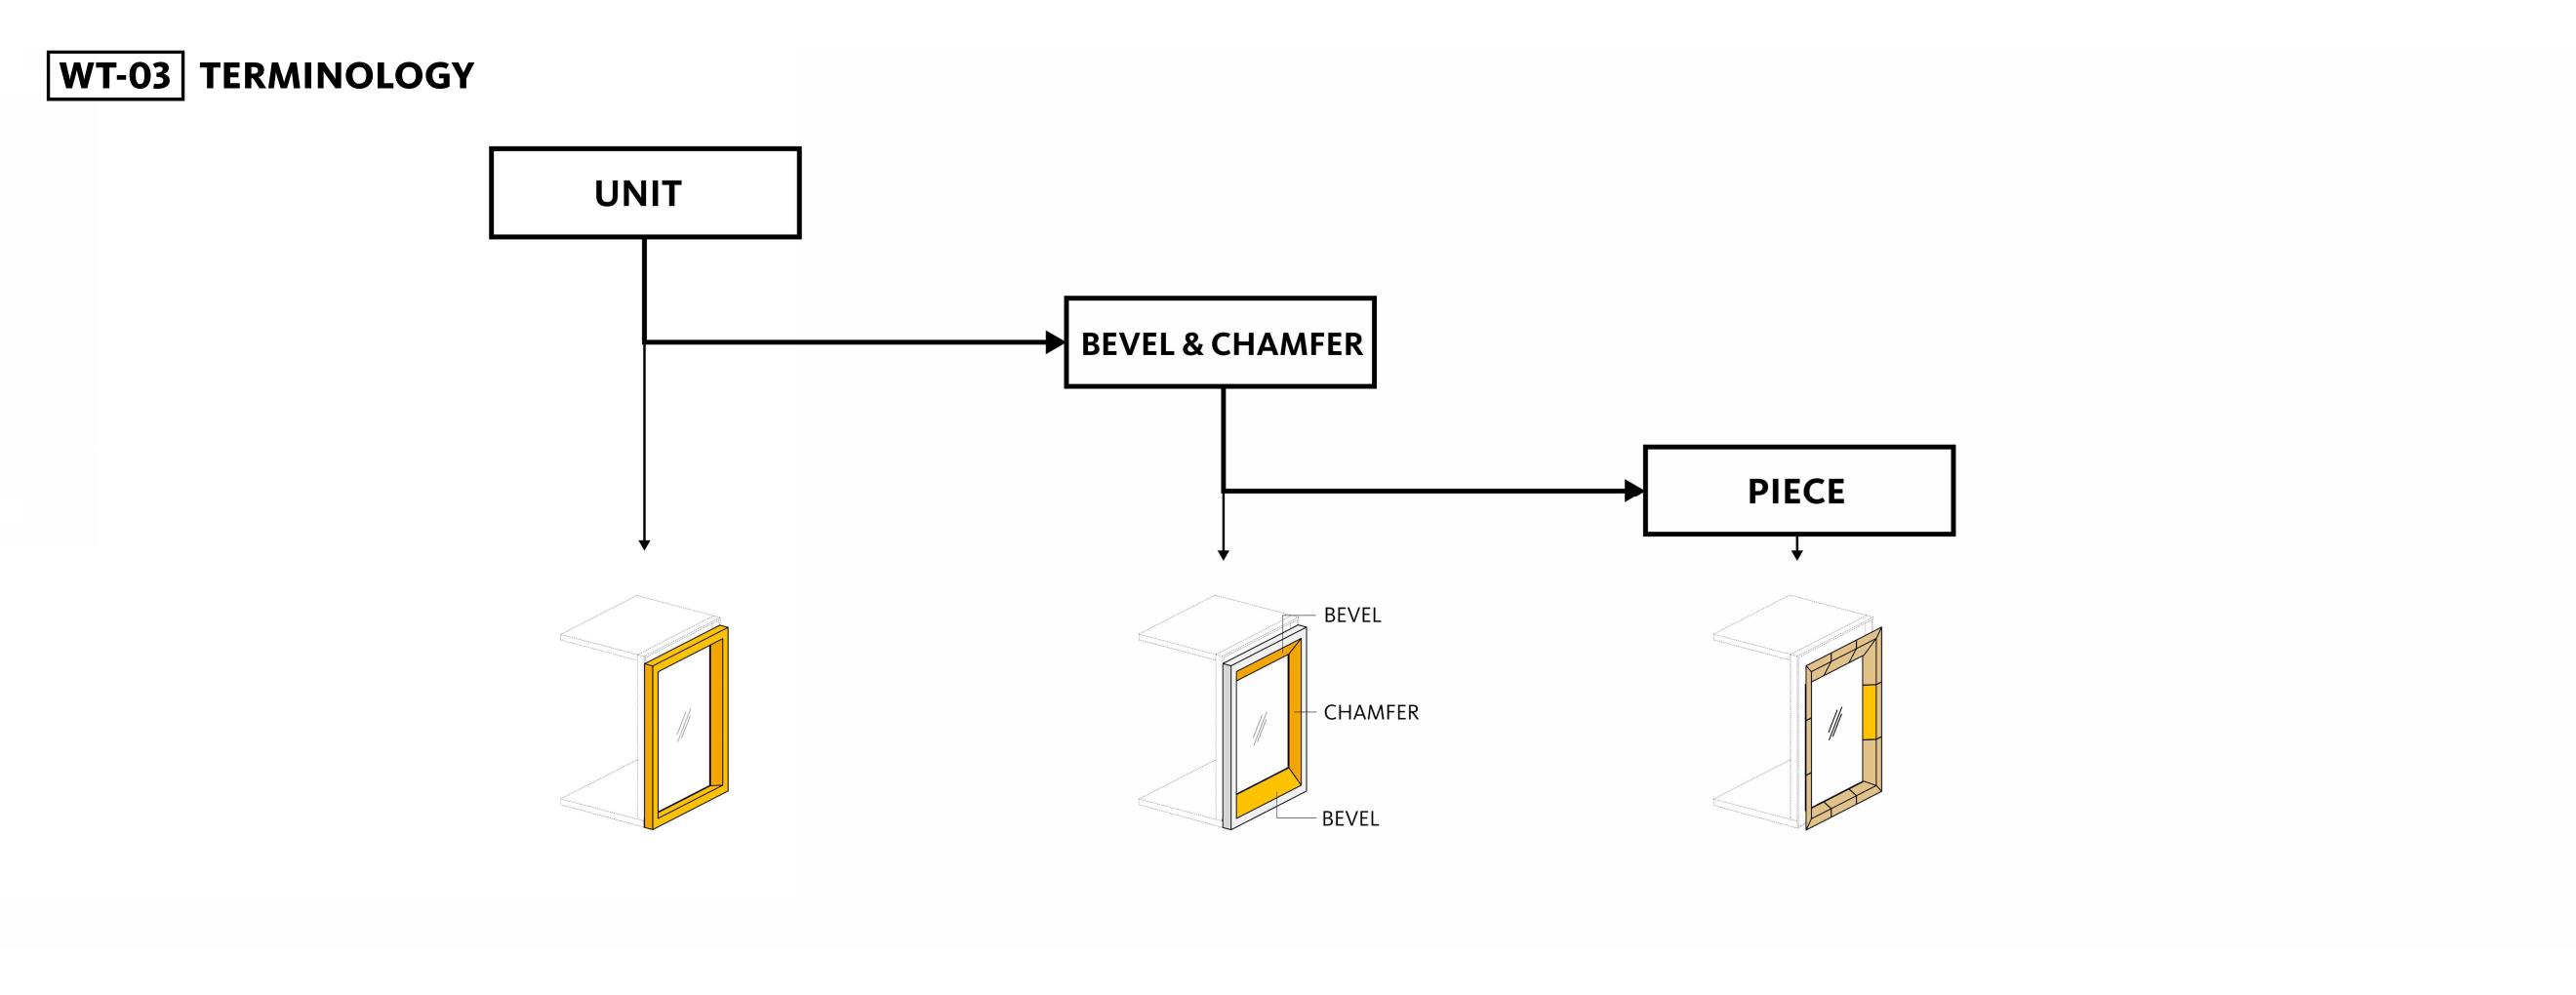 △2.Facade Terminology
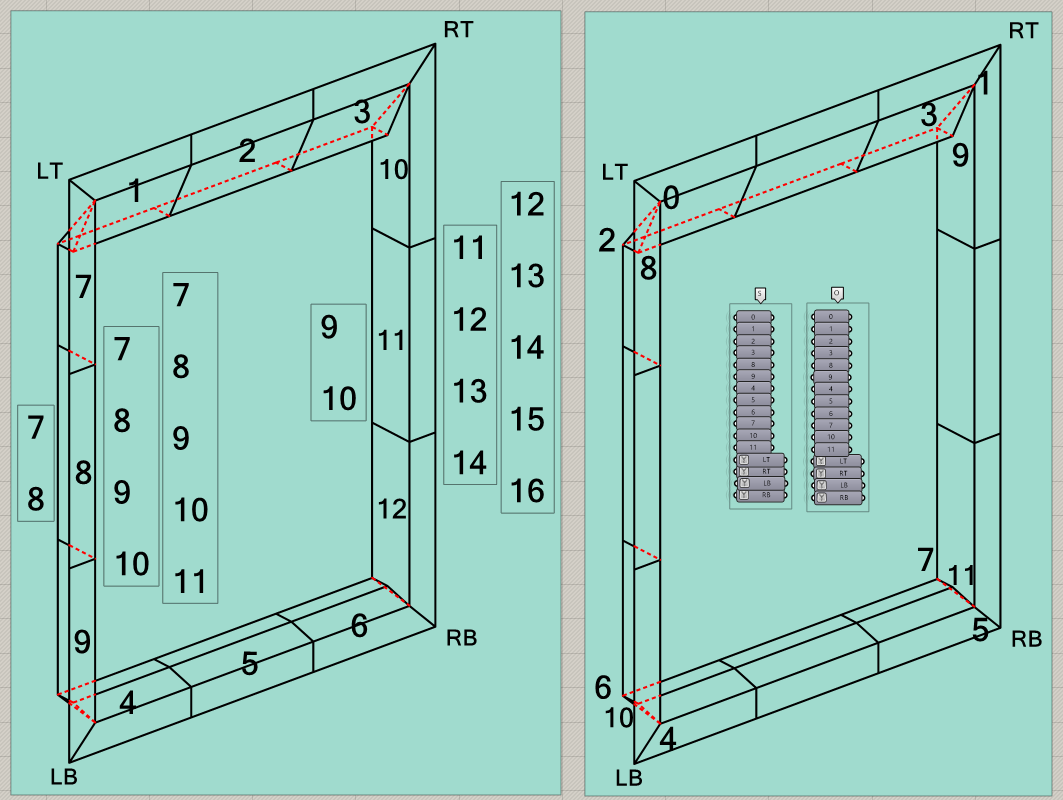
 △3.Unit Index
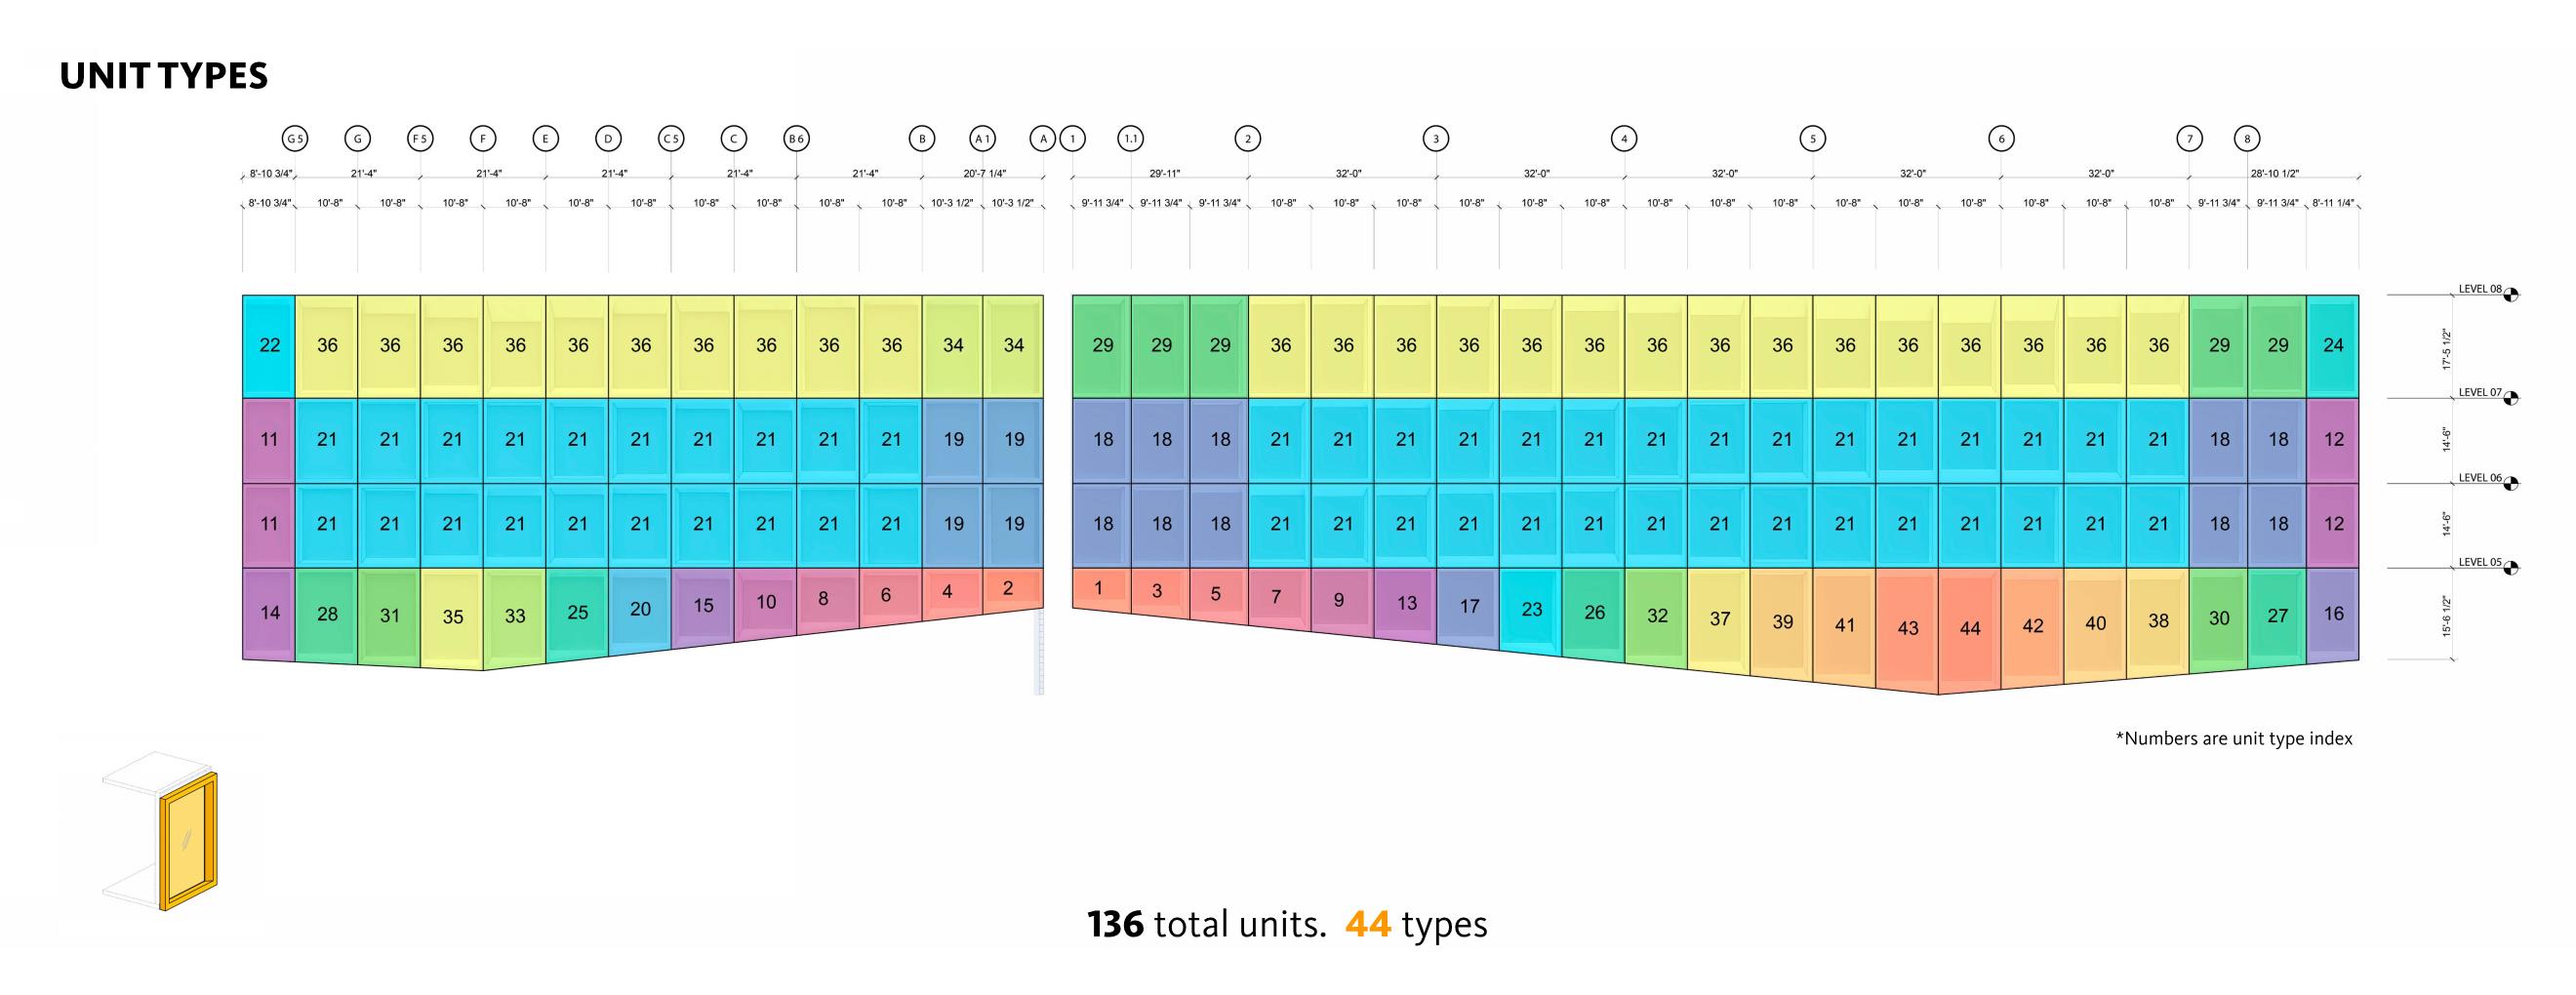 △4.Unit Types
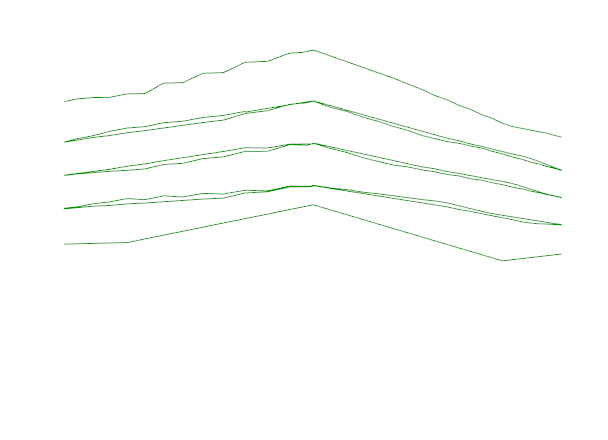
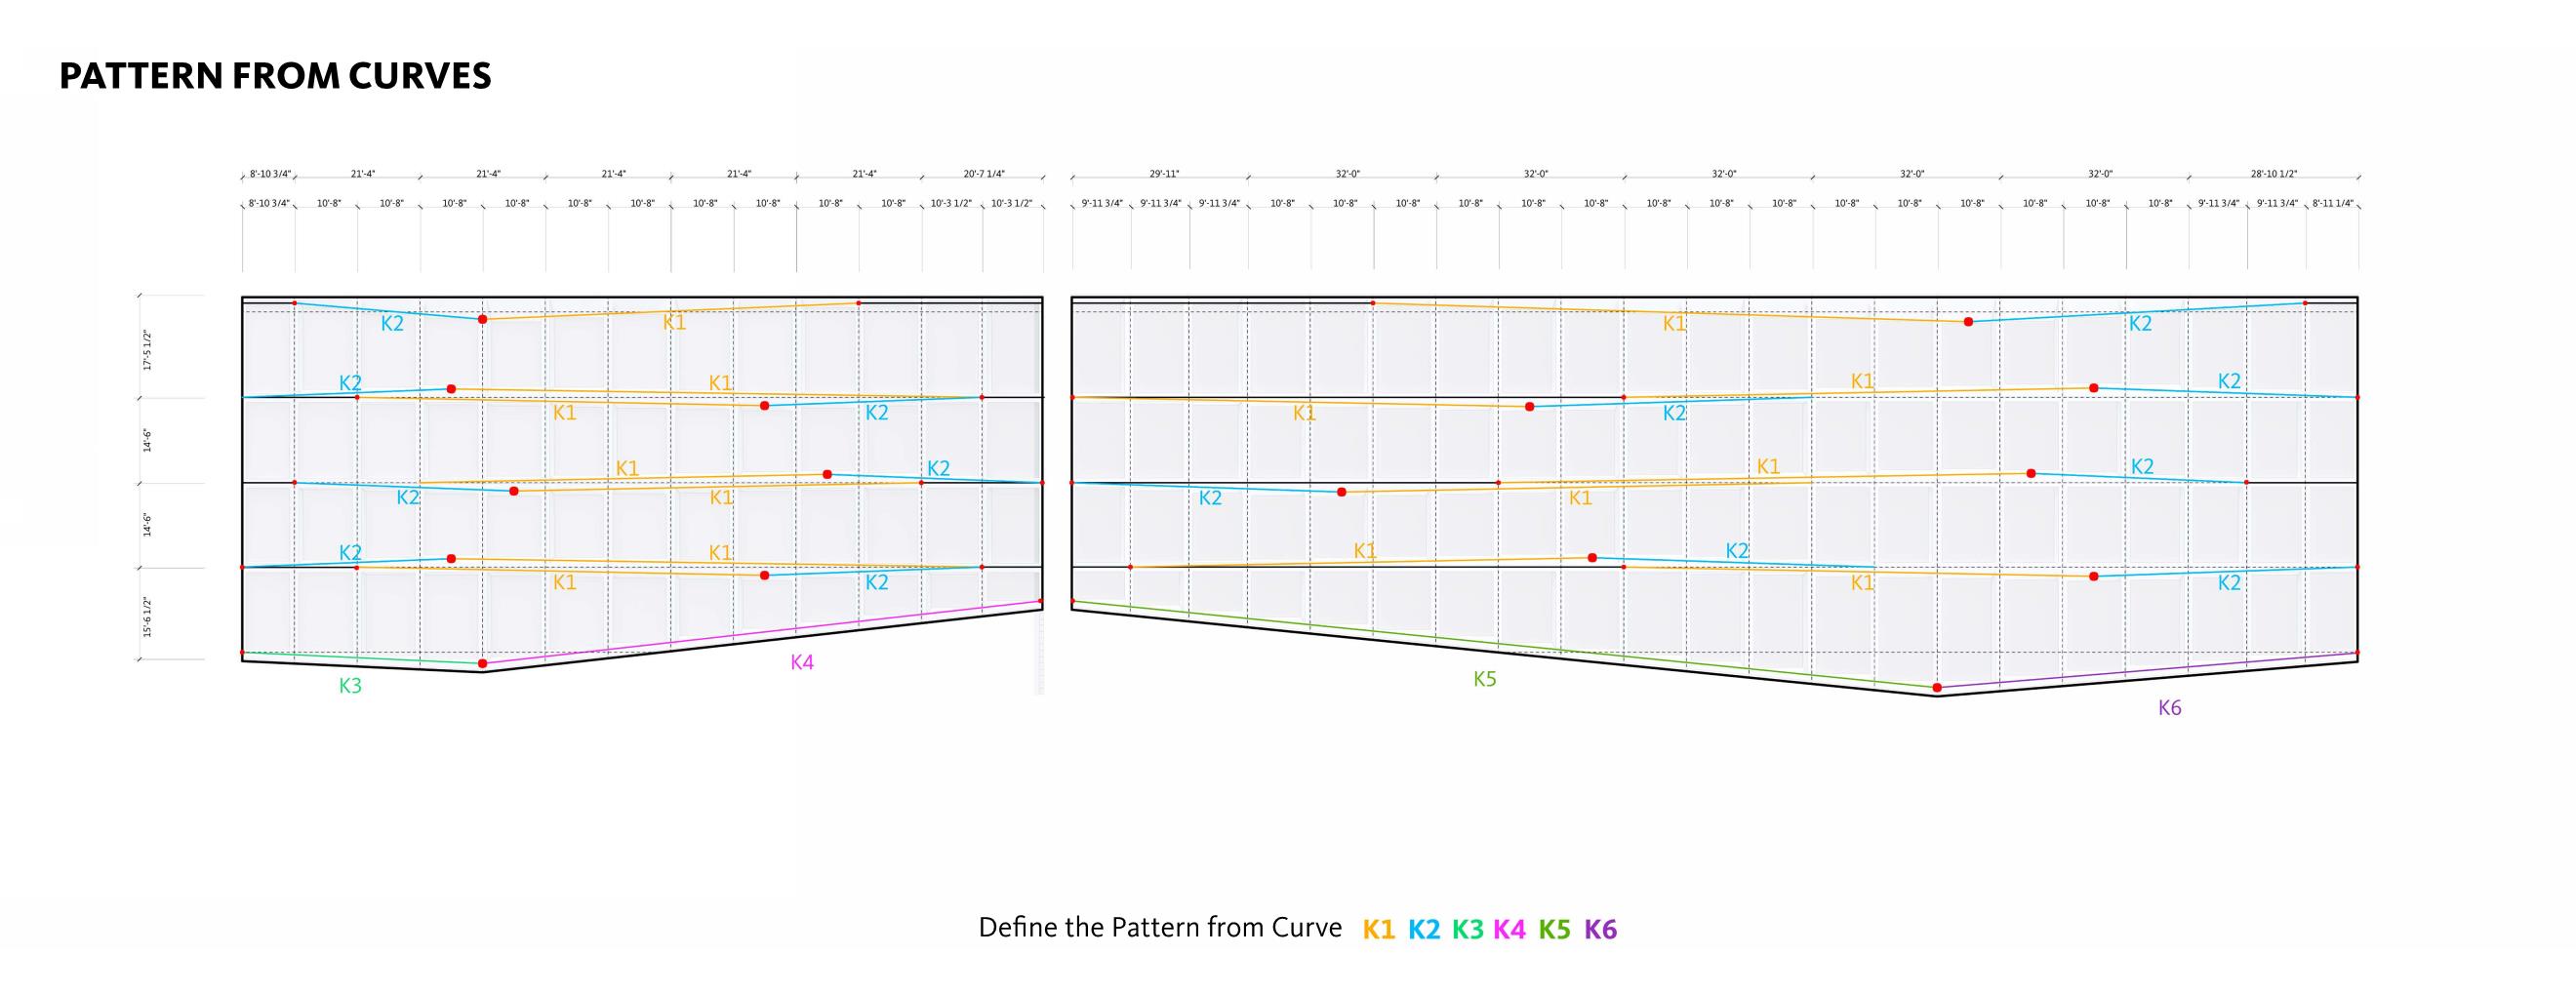 △5. Attractor Curves Composition
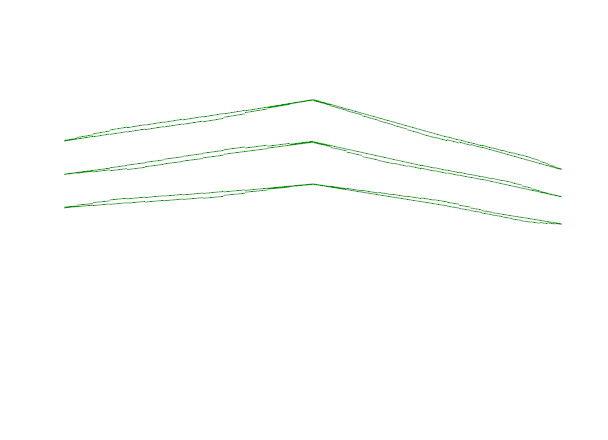
 △6. Simply the curves into rational segments
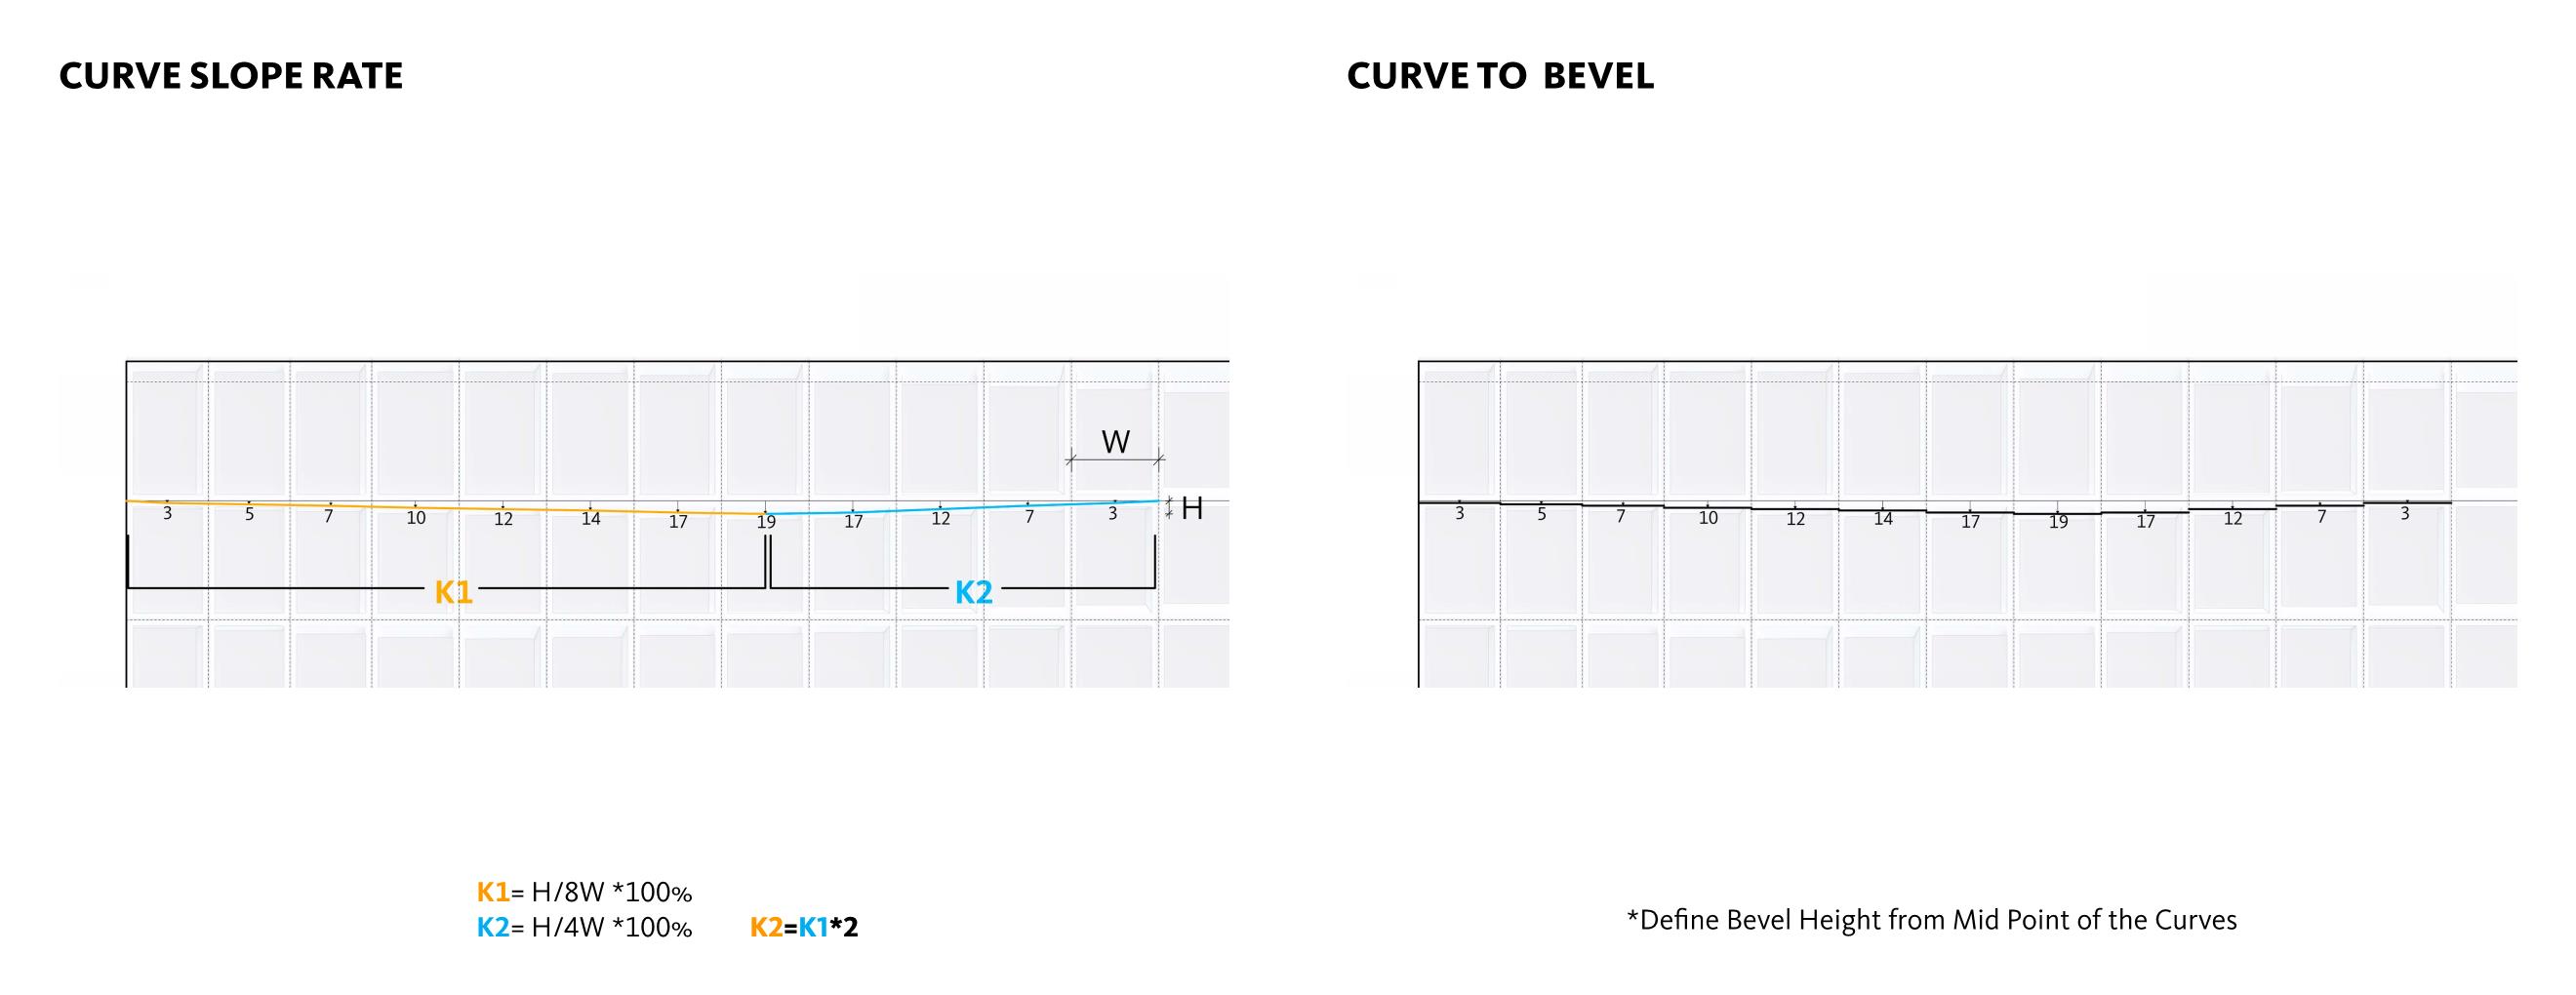
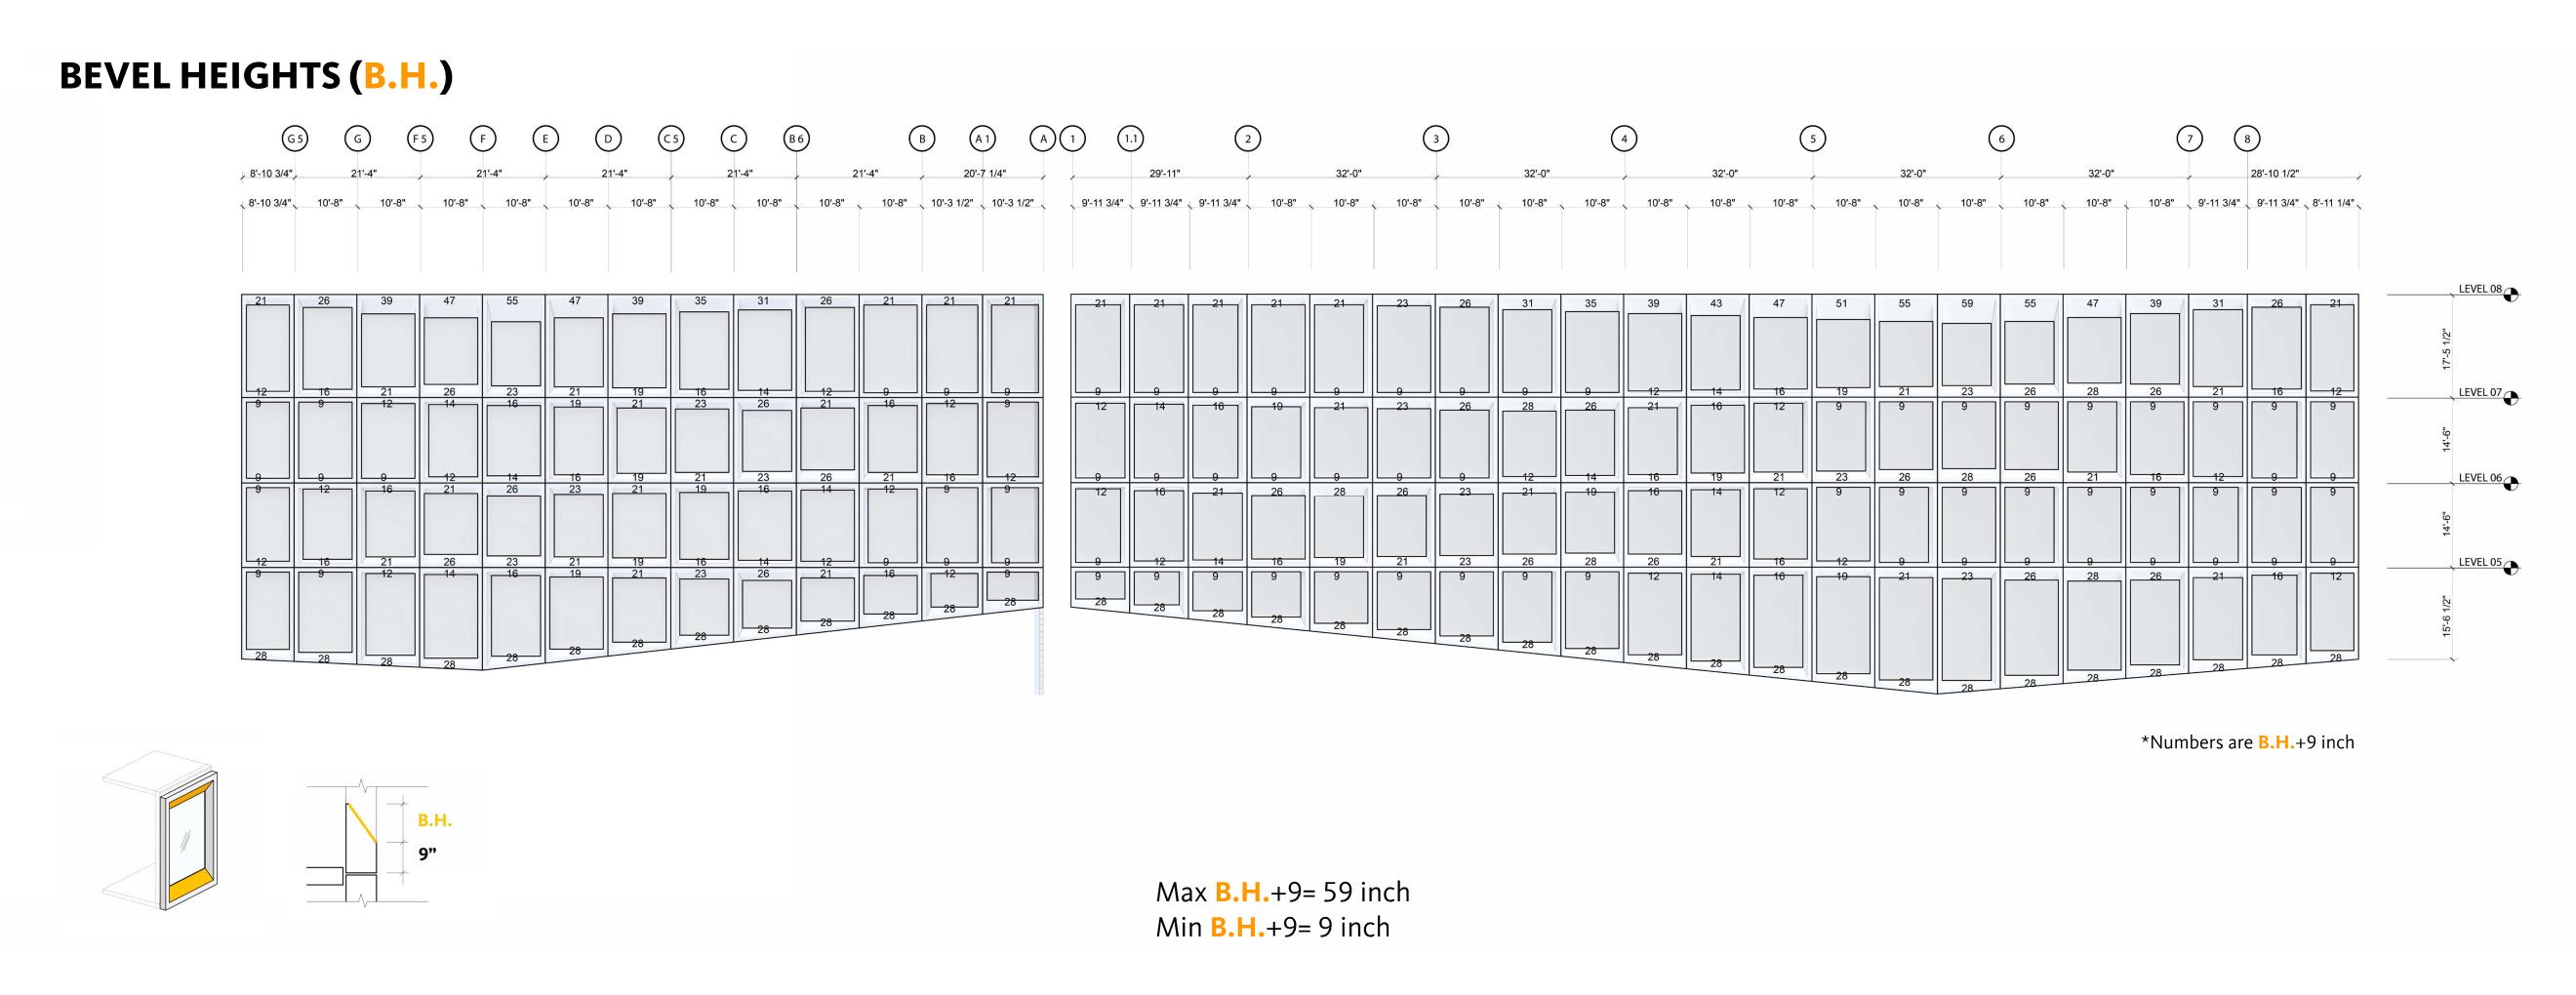 △7. Bevel Heights Distribution
 △8. Bevel Height Types visualization
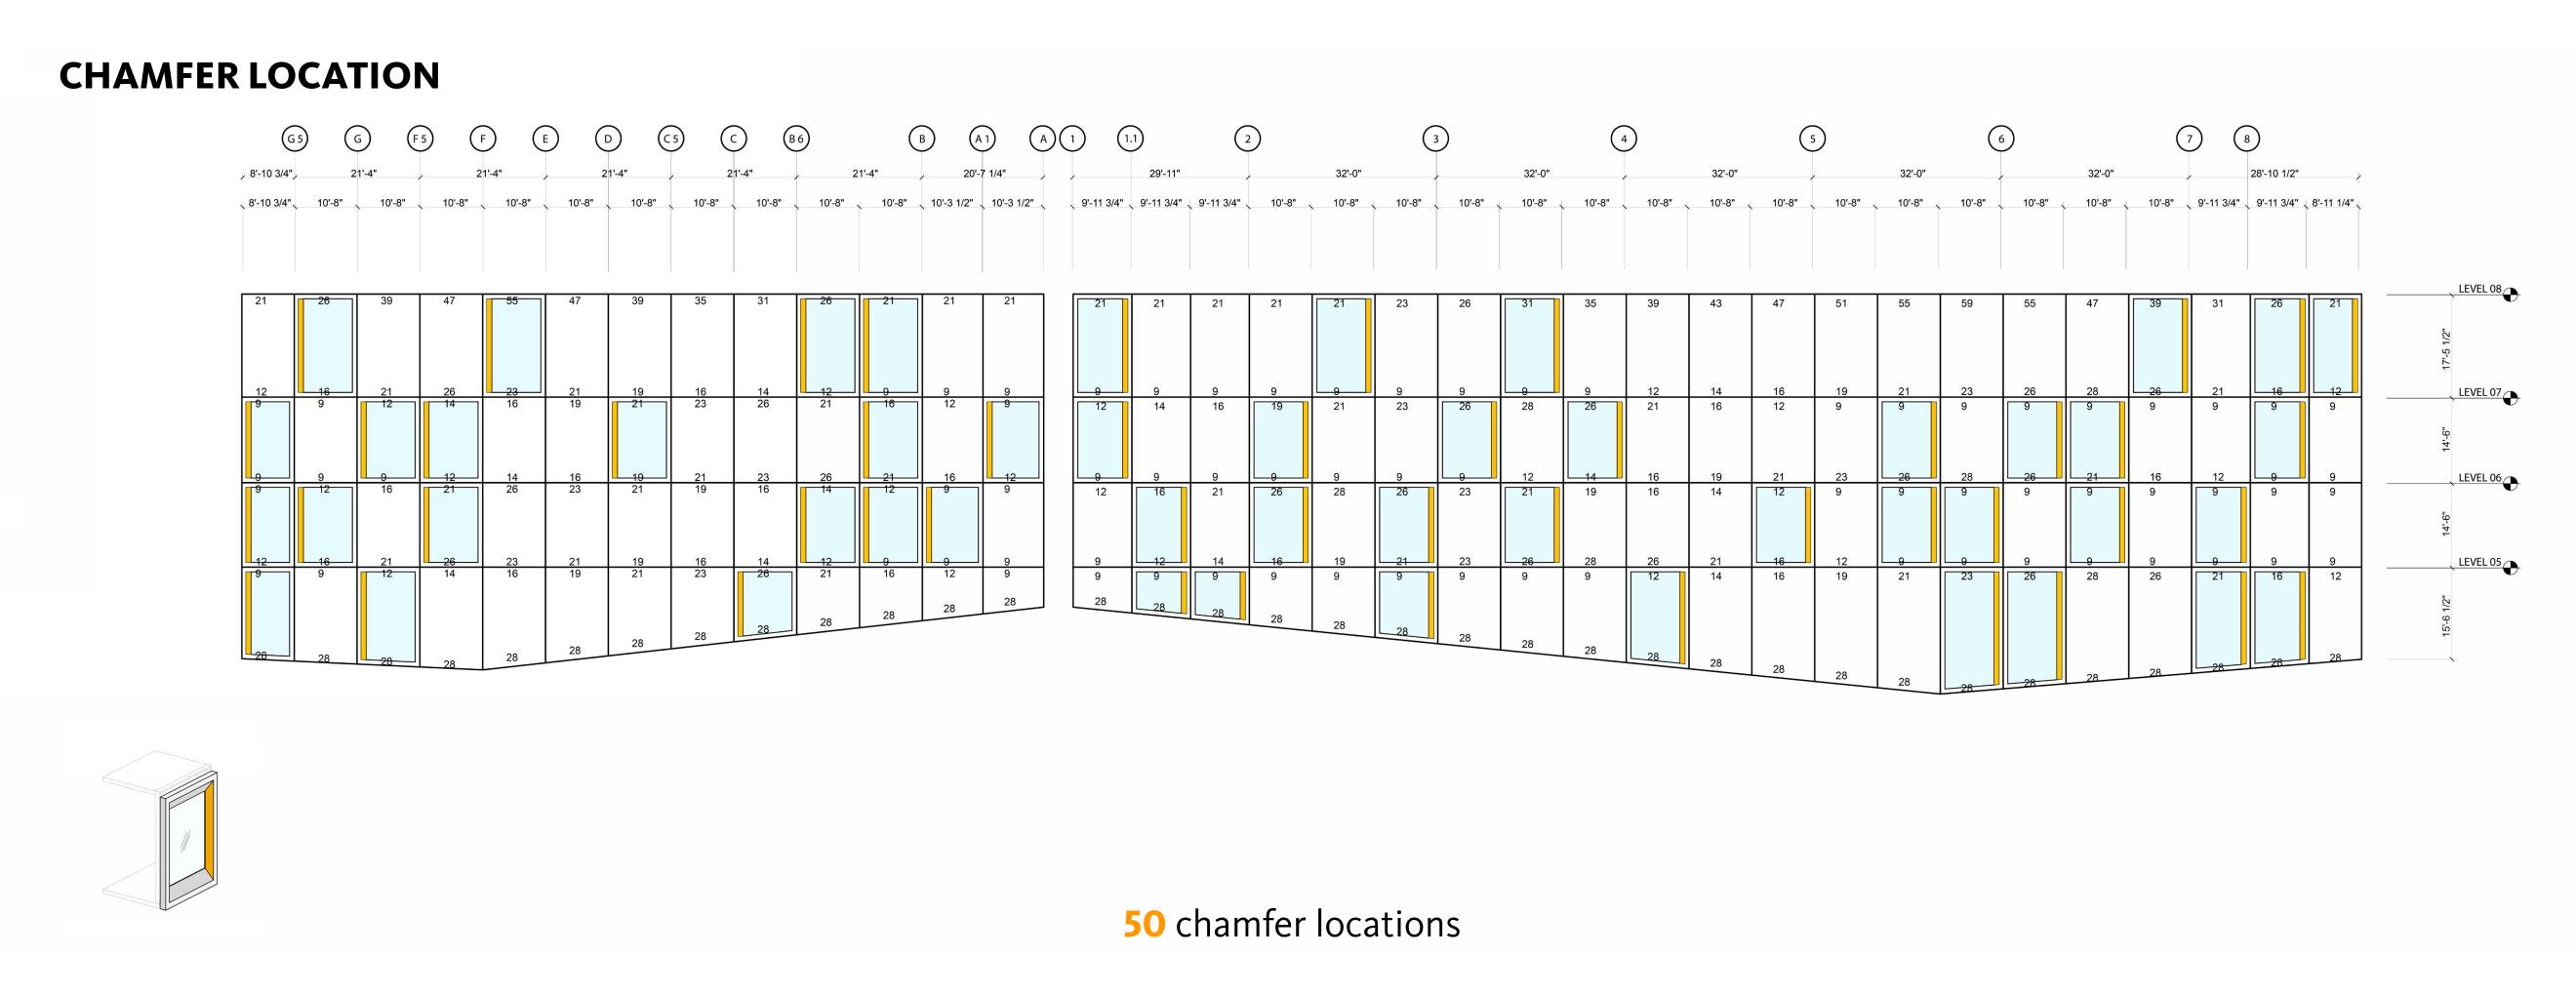 △9. Chamfer locations
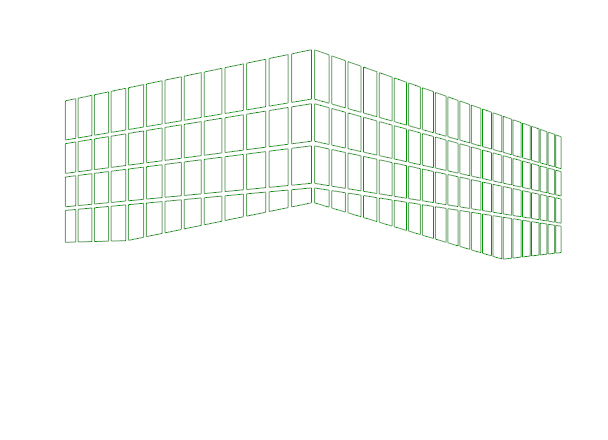
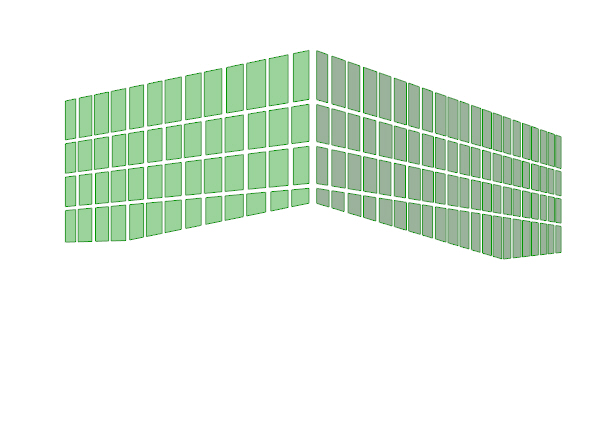
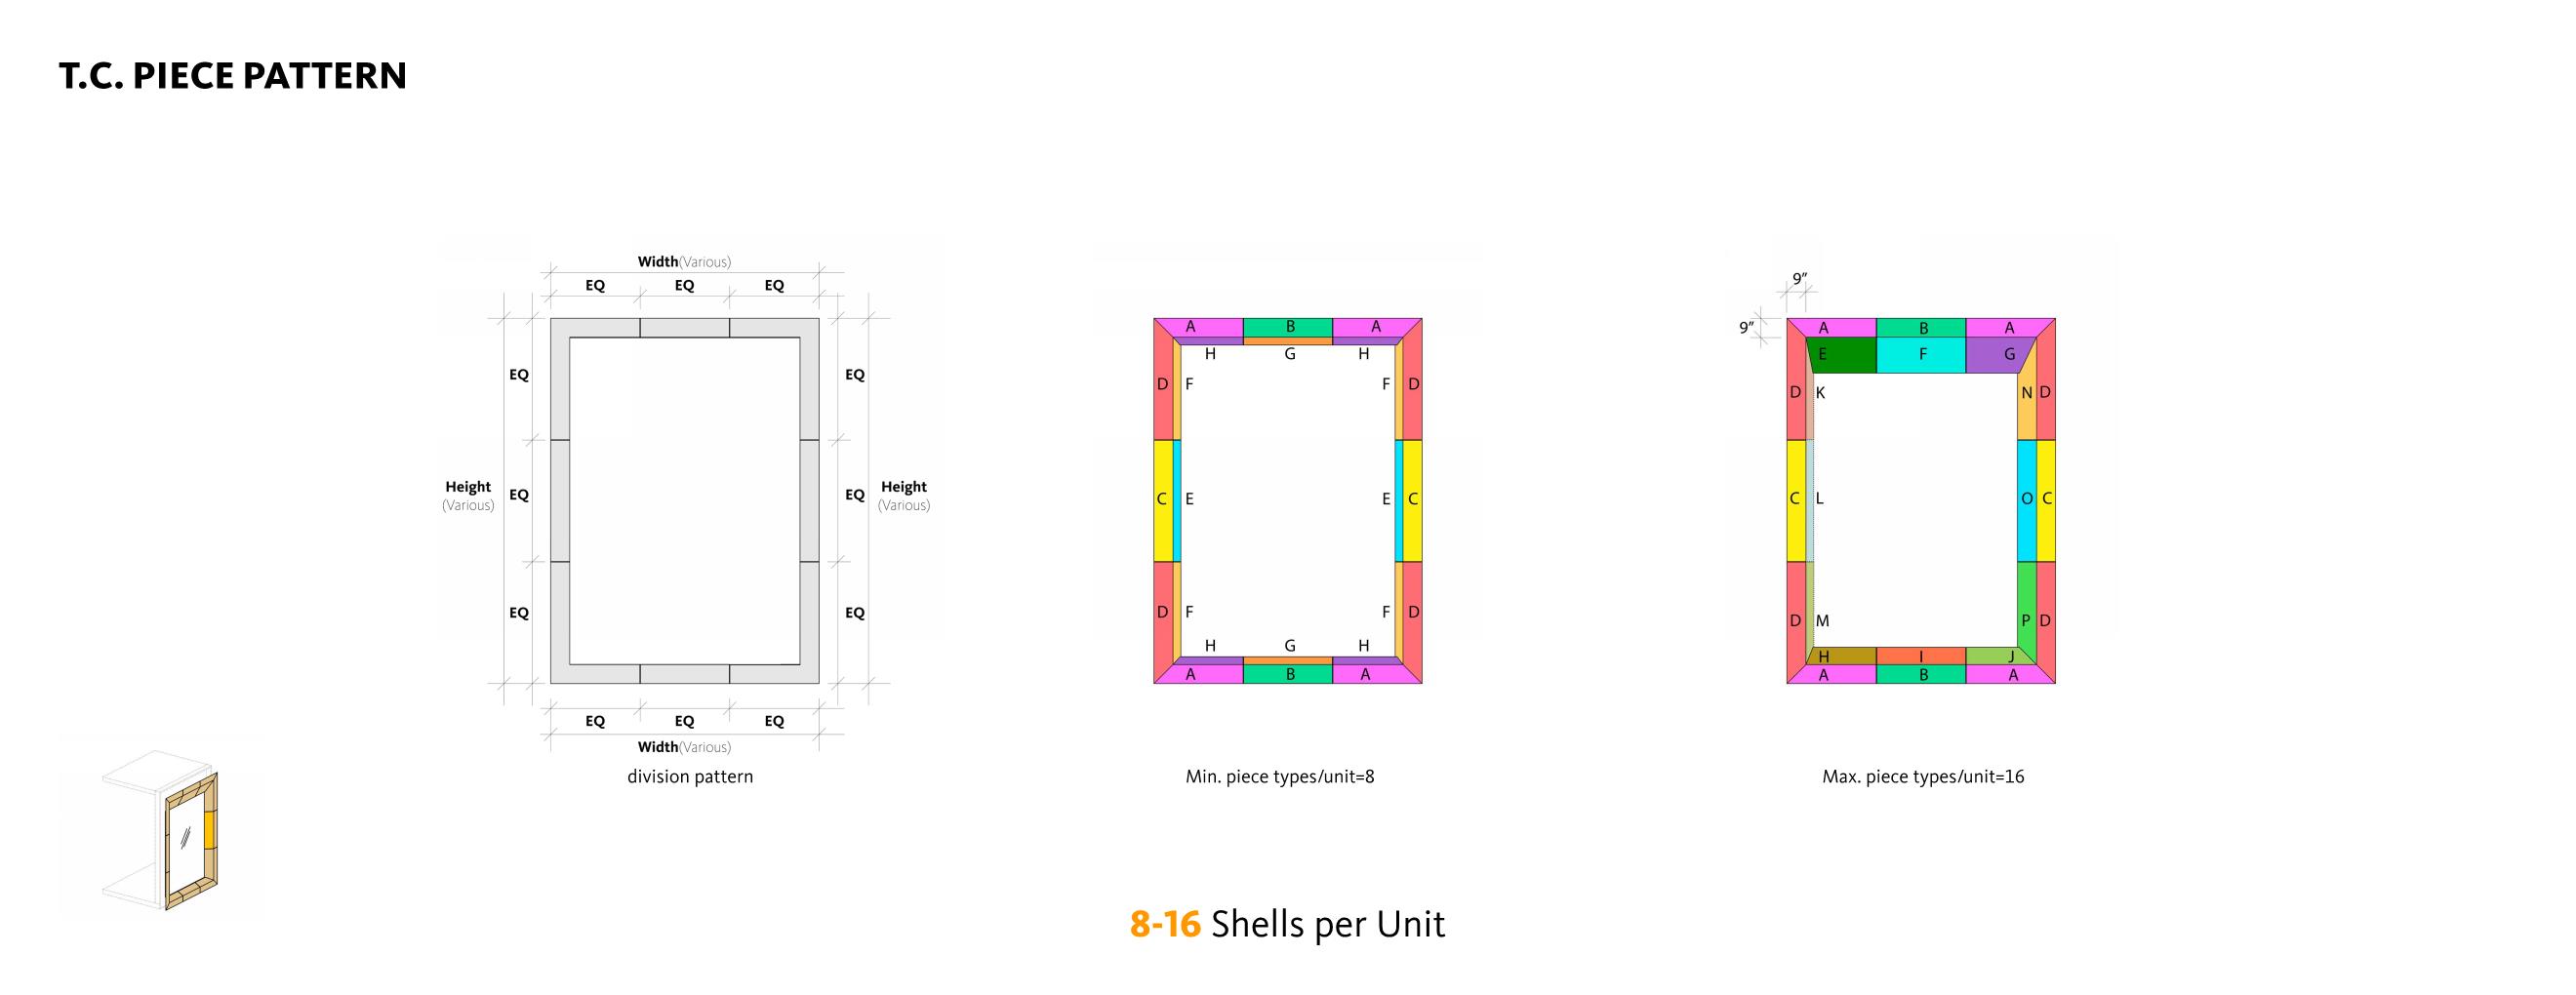 △10. Piece division
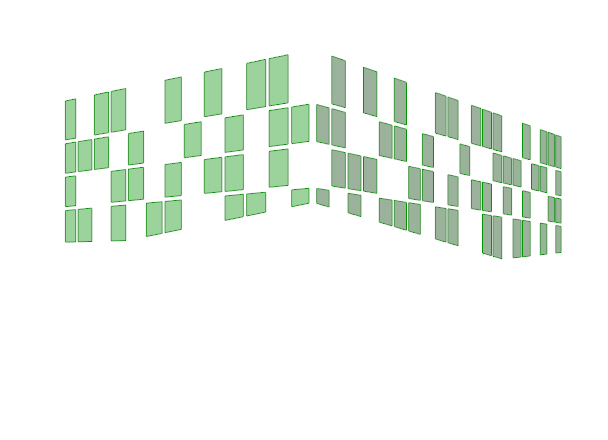
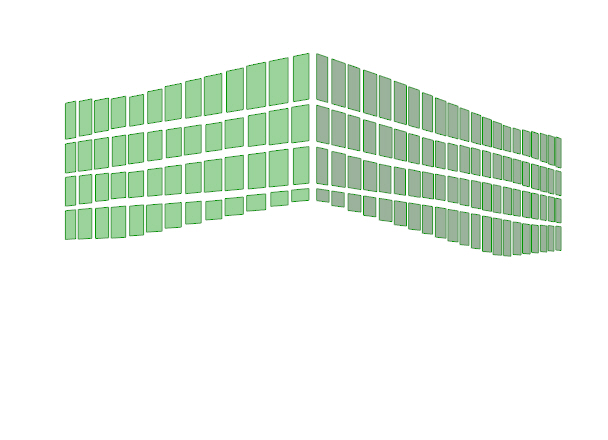
 △11. Piece distribution
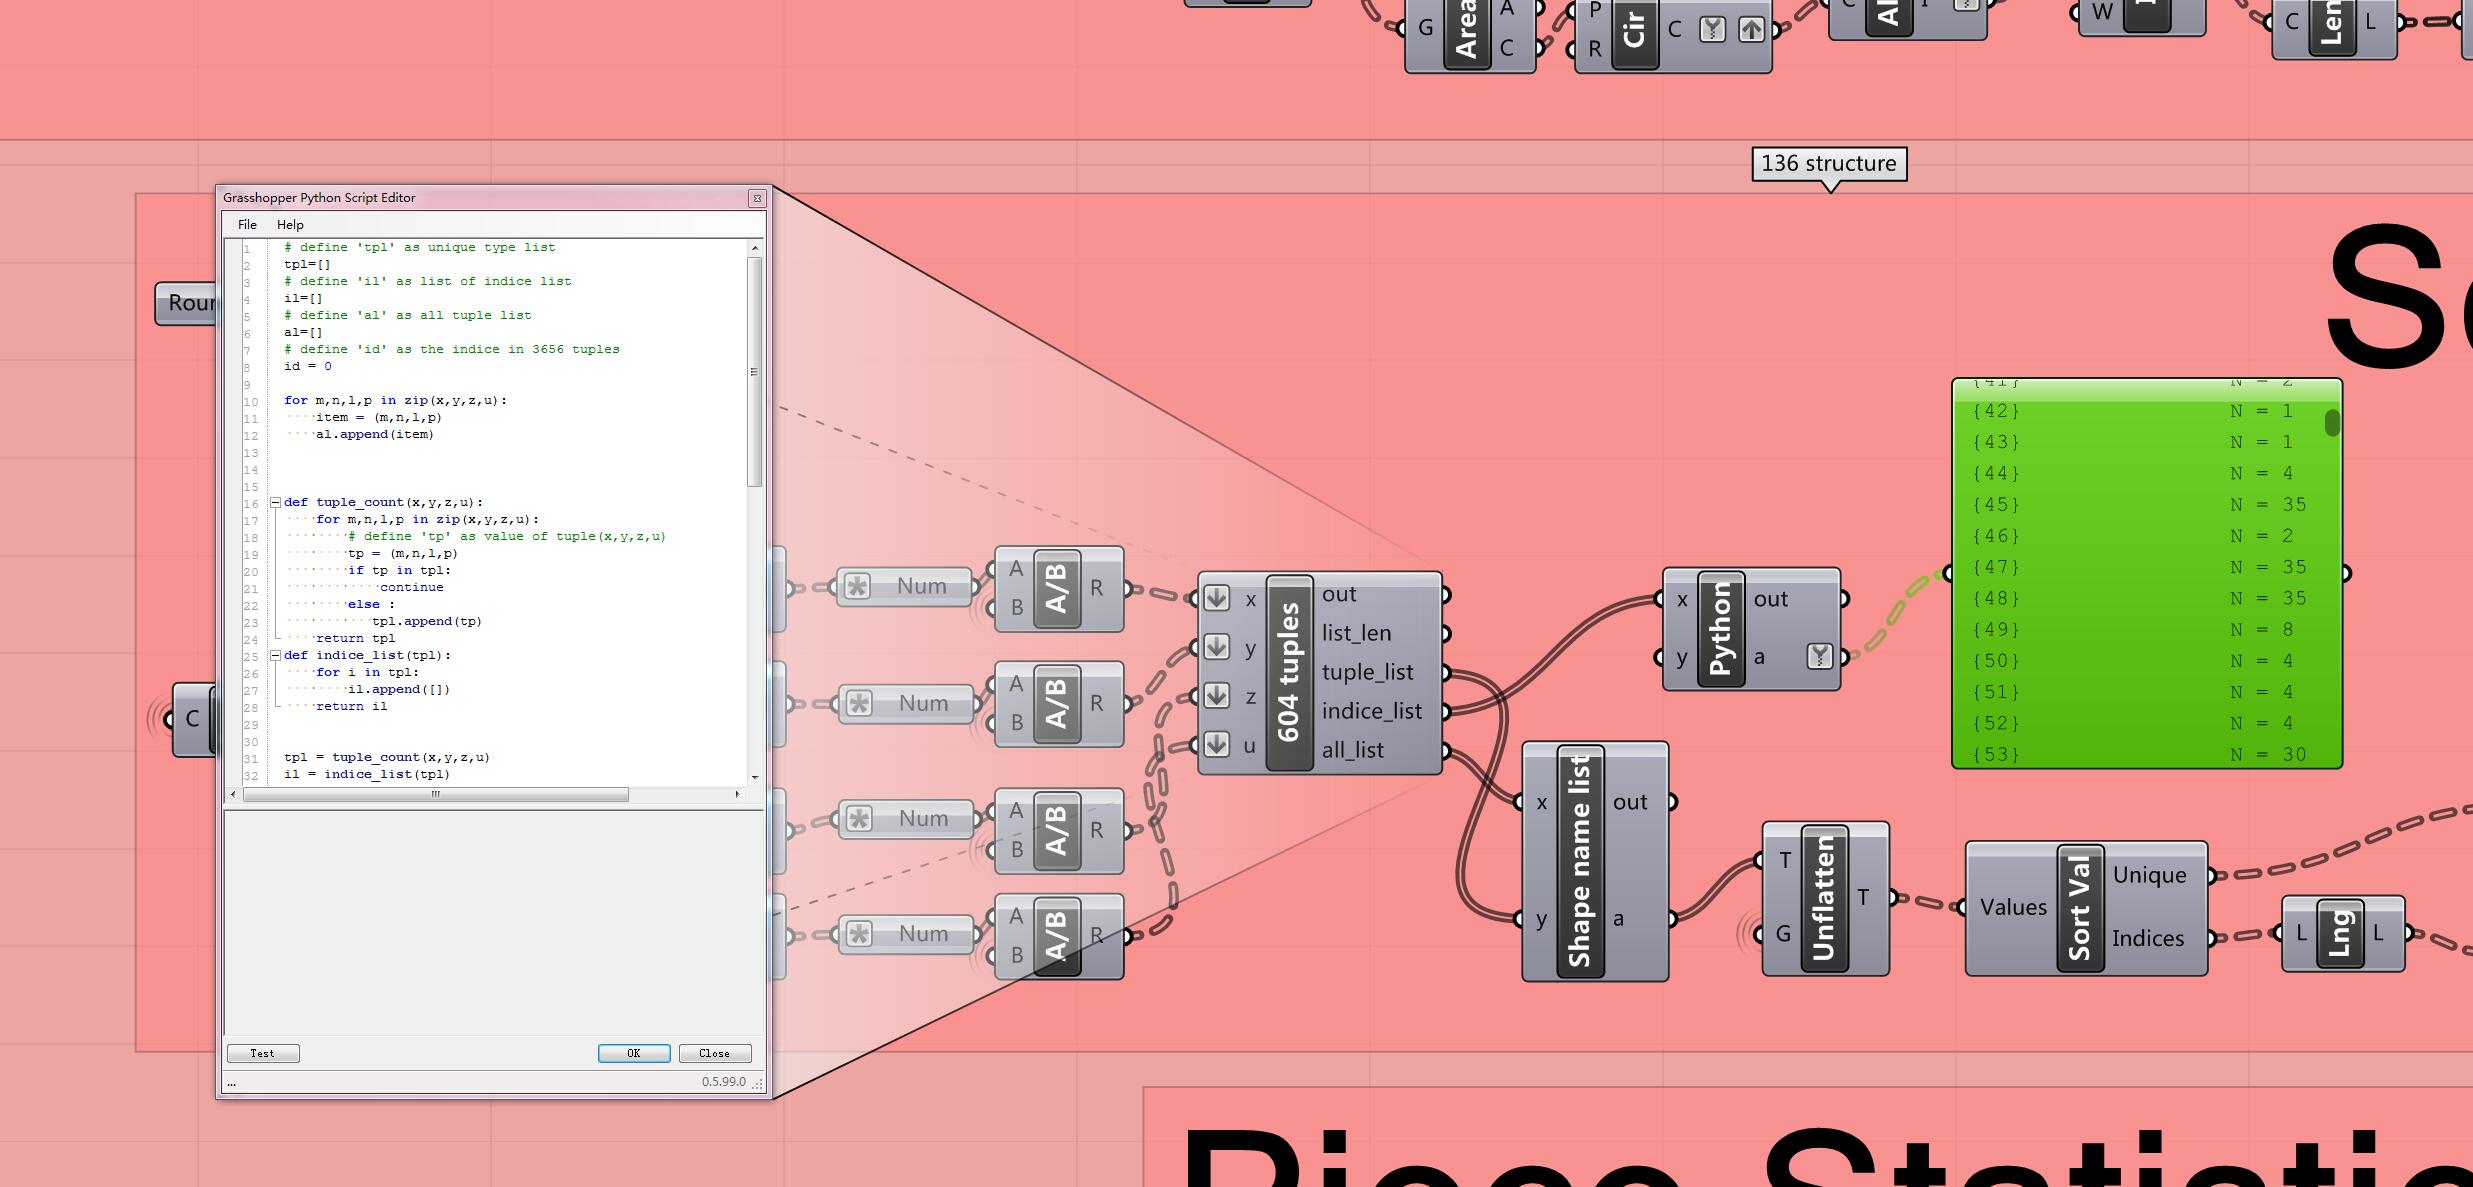 △12. Using Python to sort and category
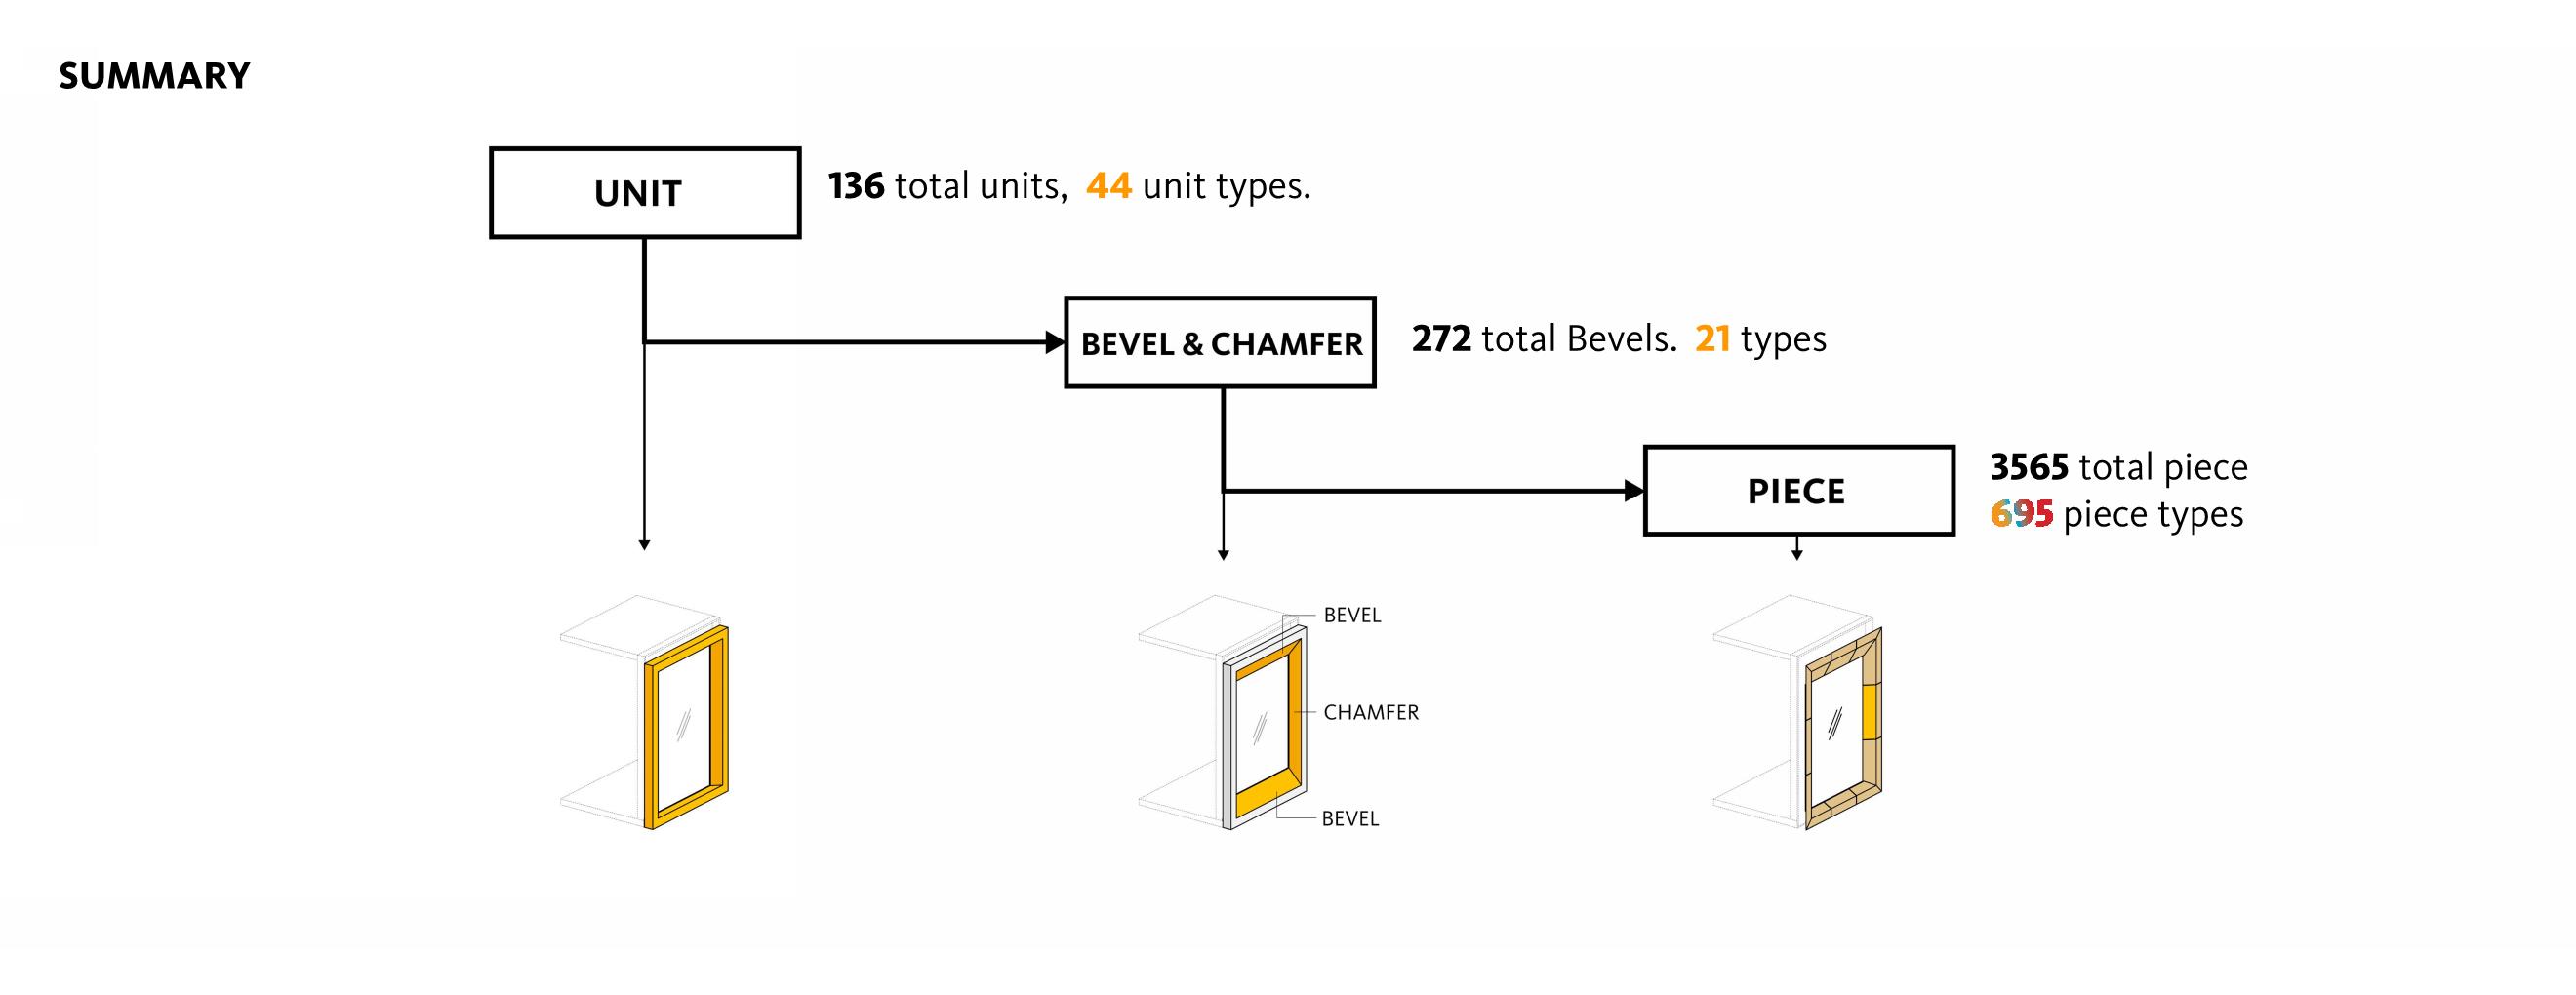 △13. Summary
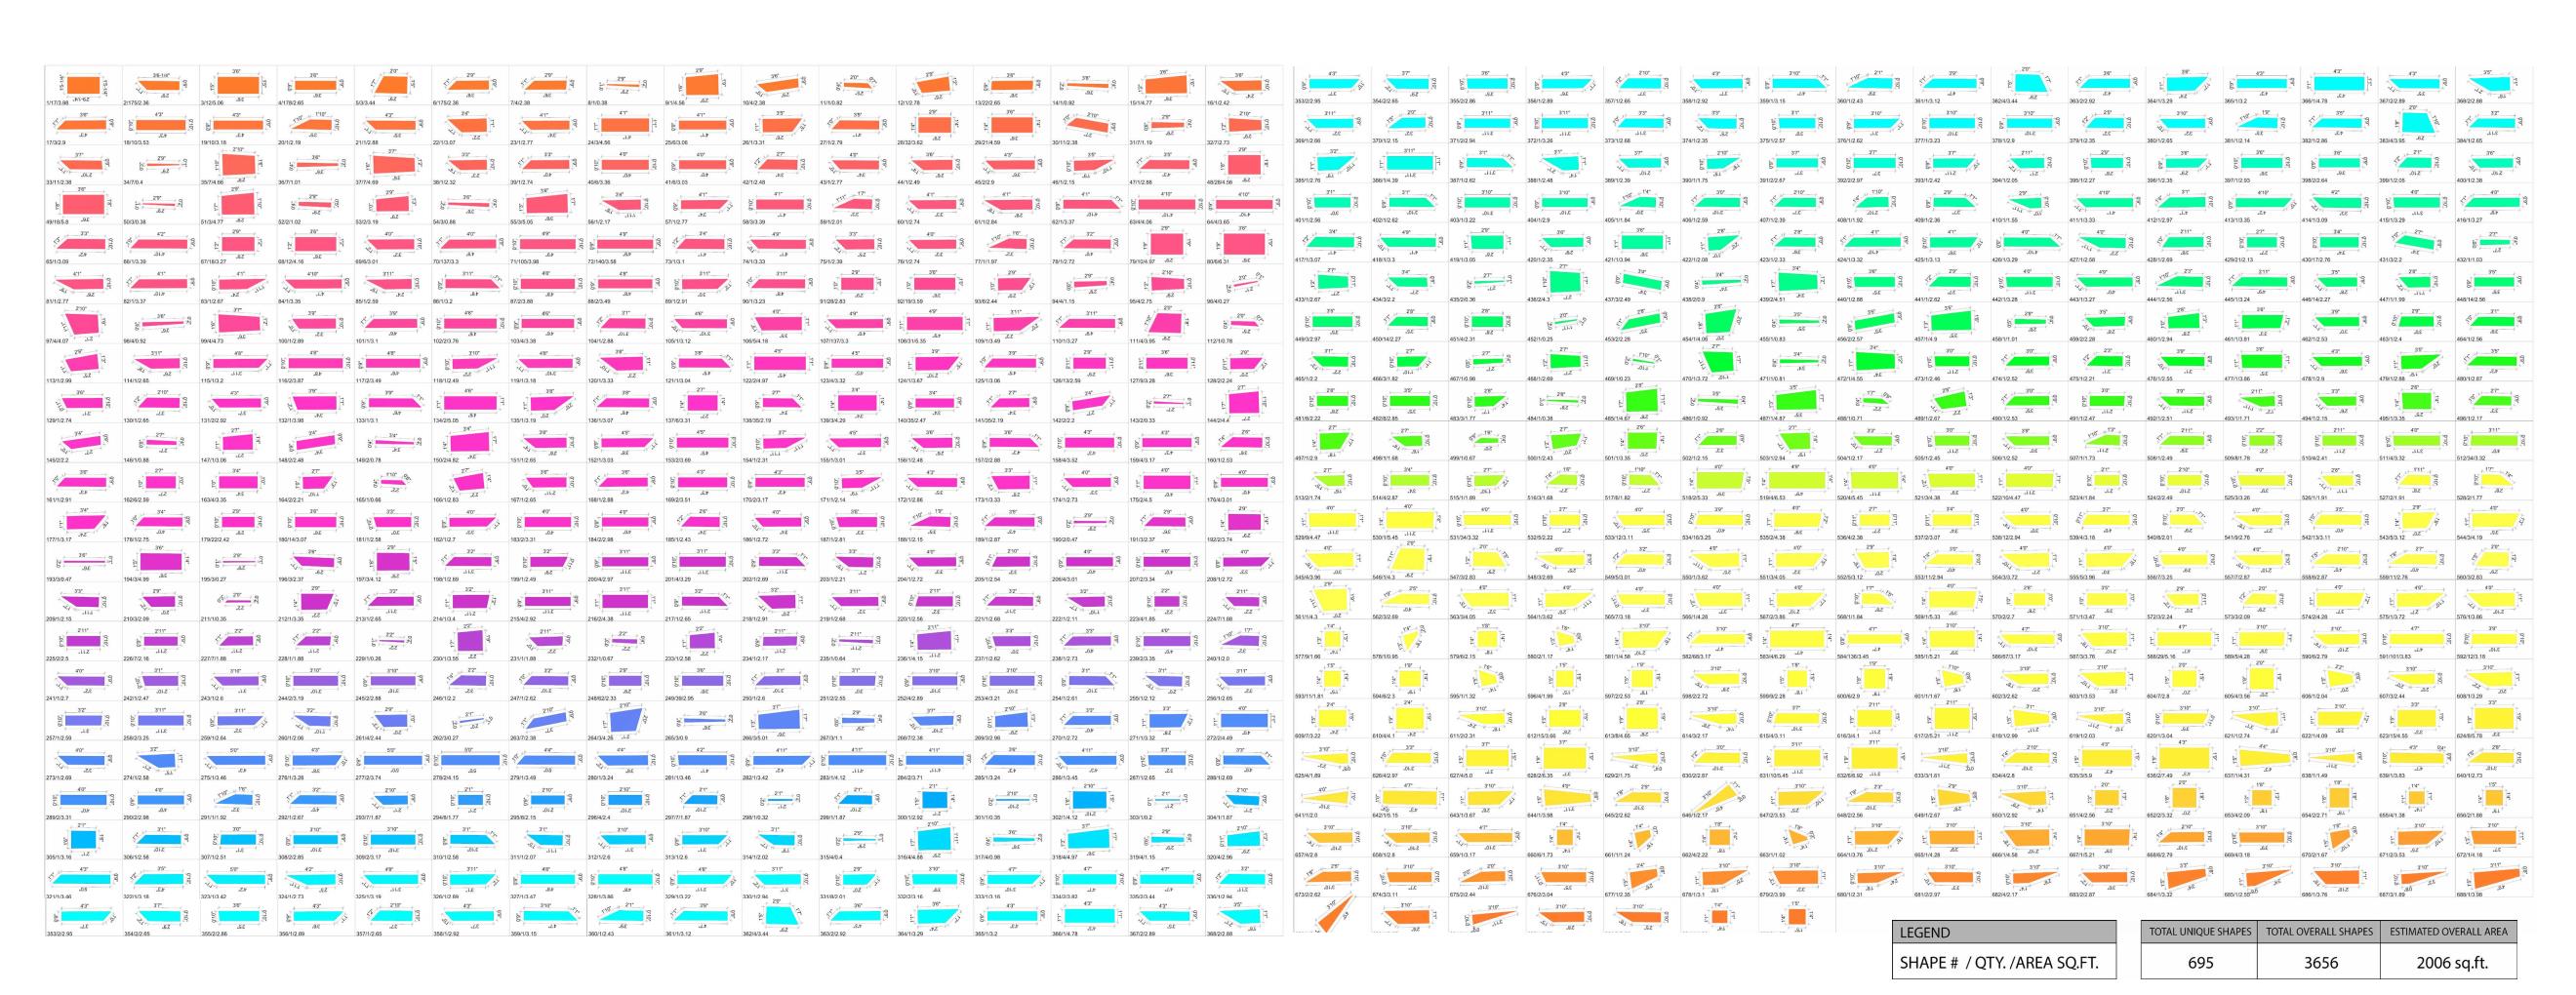 △14. Statistic analysis of piece
 △15. Statistic analysis of Each Unit
 △16. Summary
5. Optimizing
The last step of design iteration is Optimization. Although we talk about this step at the last, the idea of optimizing is supposed to be kept in mind in every step. Since the essence of design iteration is to test design options by visualizing and analyzing, some computational tools will be great helpful in doing this. Galapagos
is a “Evolutionary Computing” plugin that generate rapid results that satisfies some preset Rules, and evolve the results to achieve an established Goal as close as possible. Because of the existence of infinite ‘correct’ design options, designers could pick from the top winners and apply their preference. Also you could retrieve the results by saving the option Index.
In the example, the task of the optimization here is basically to generate a certain Pattern on a facade paneling system, replacing the selected unified panels with a special module A, leaving the rest of panels as default module B. In this task, we shall clarify our Rules, Goal and Index to generate the Pattern:
Rules:
- Rule1: The module A selection is only selected among the parent panel systems;
- Rule2: The selection is random;
- Rule3: The rule was set to define a number which represents the value of the selection, the number was resulted from weighted sum of unique property of each selected module.
Goal: The selection shall result in minimized value.
Index: The random selection is achieved by the ![]() Random Reduce component. The input Seed shall be the index of a certain selection.
Random Reduce component. The input Seed shall be the index of a certain selection.
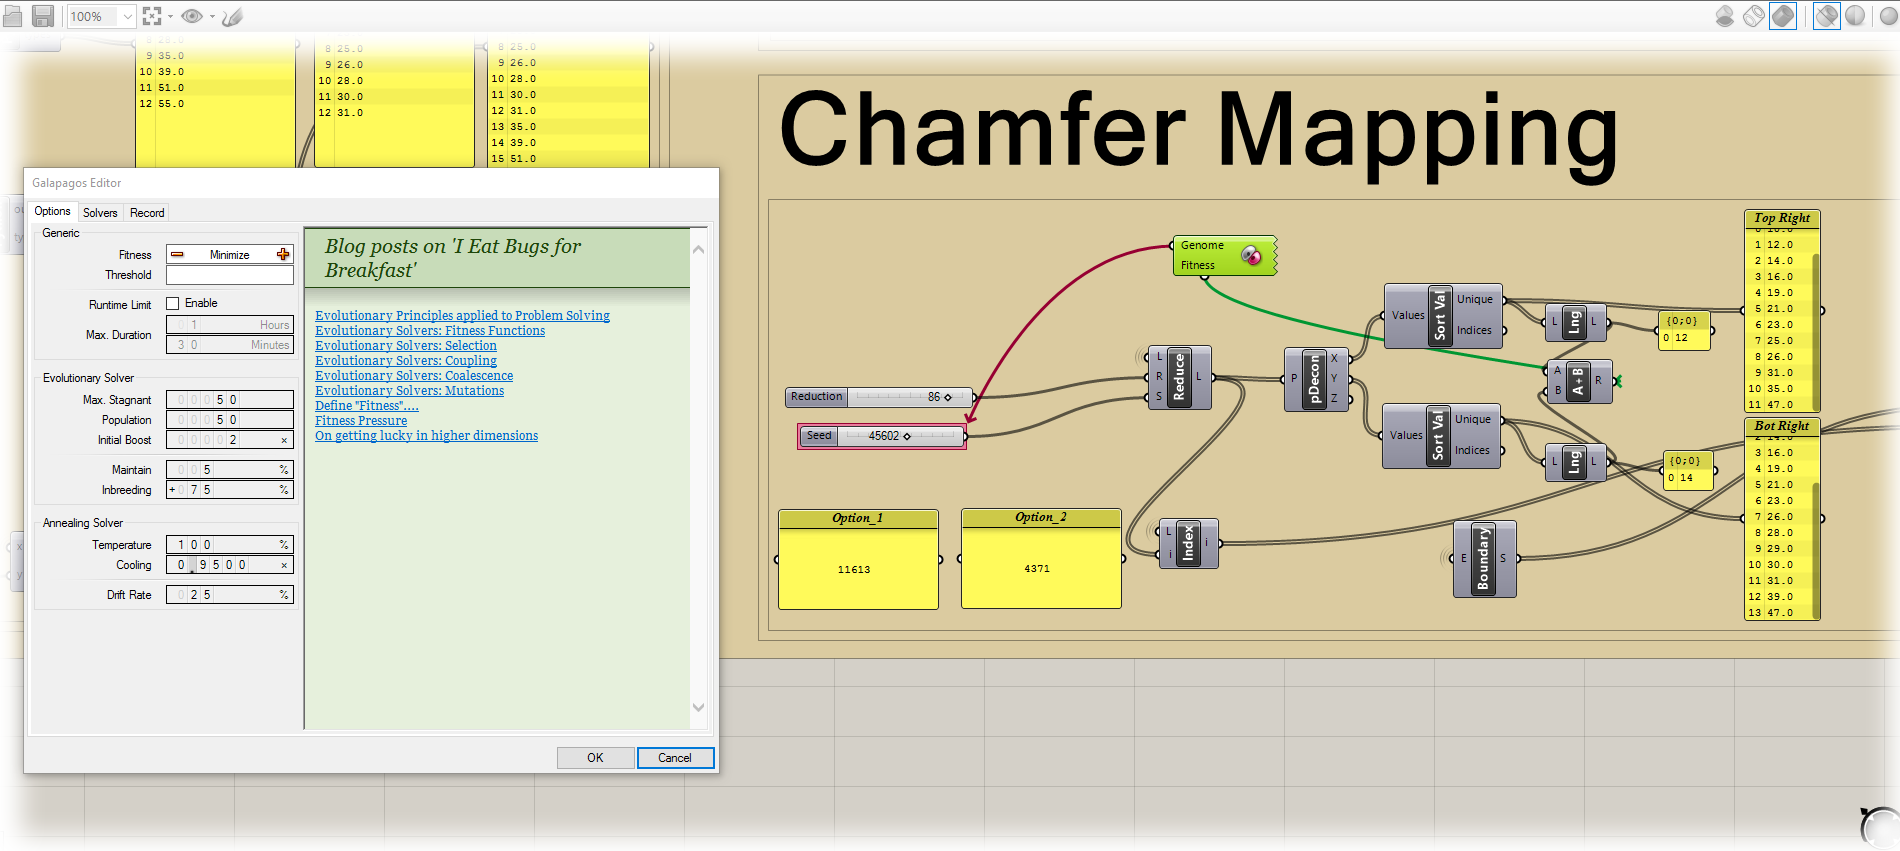 △Screenshots of Galapagos setting interface.
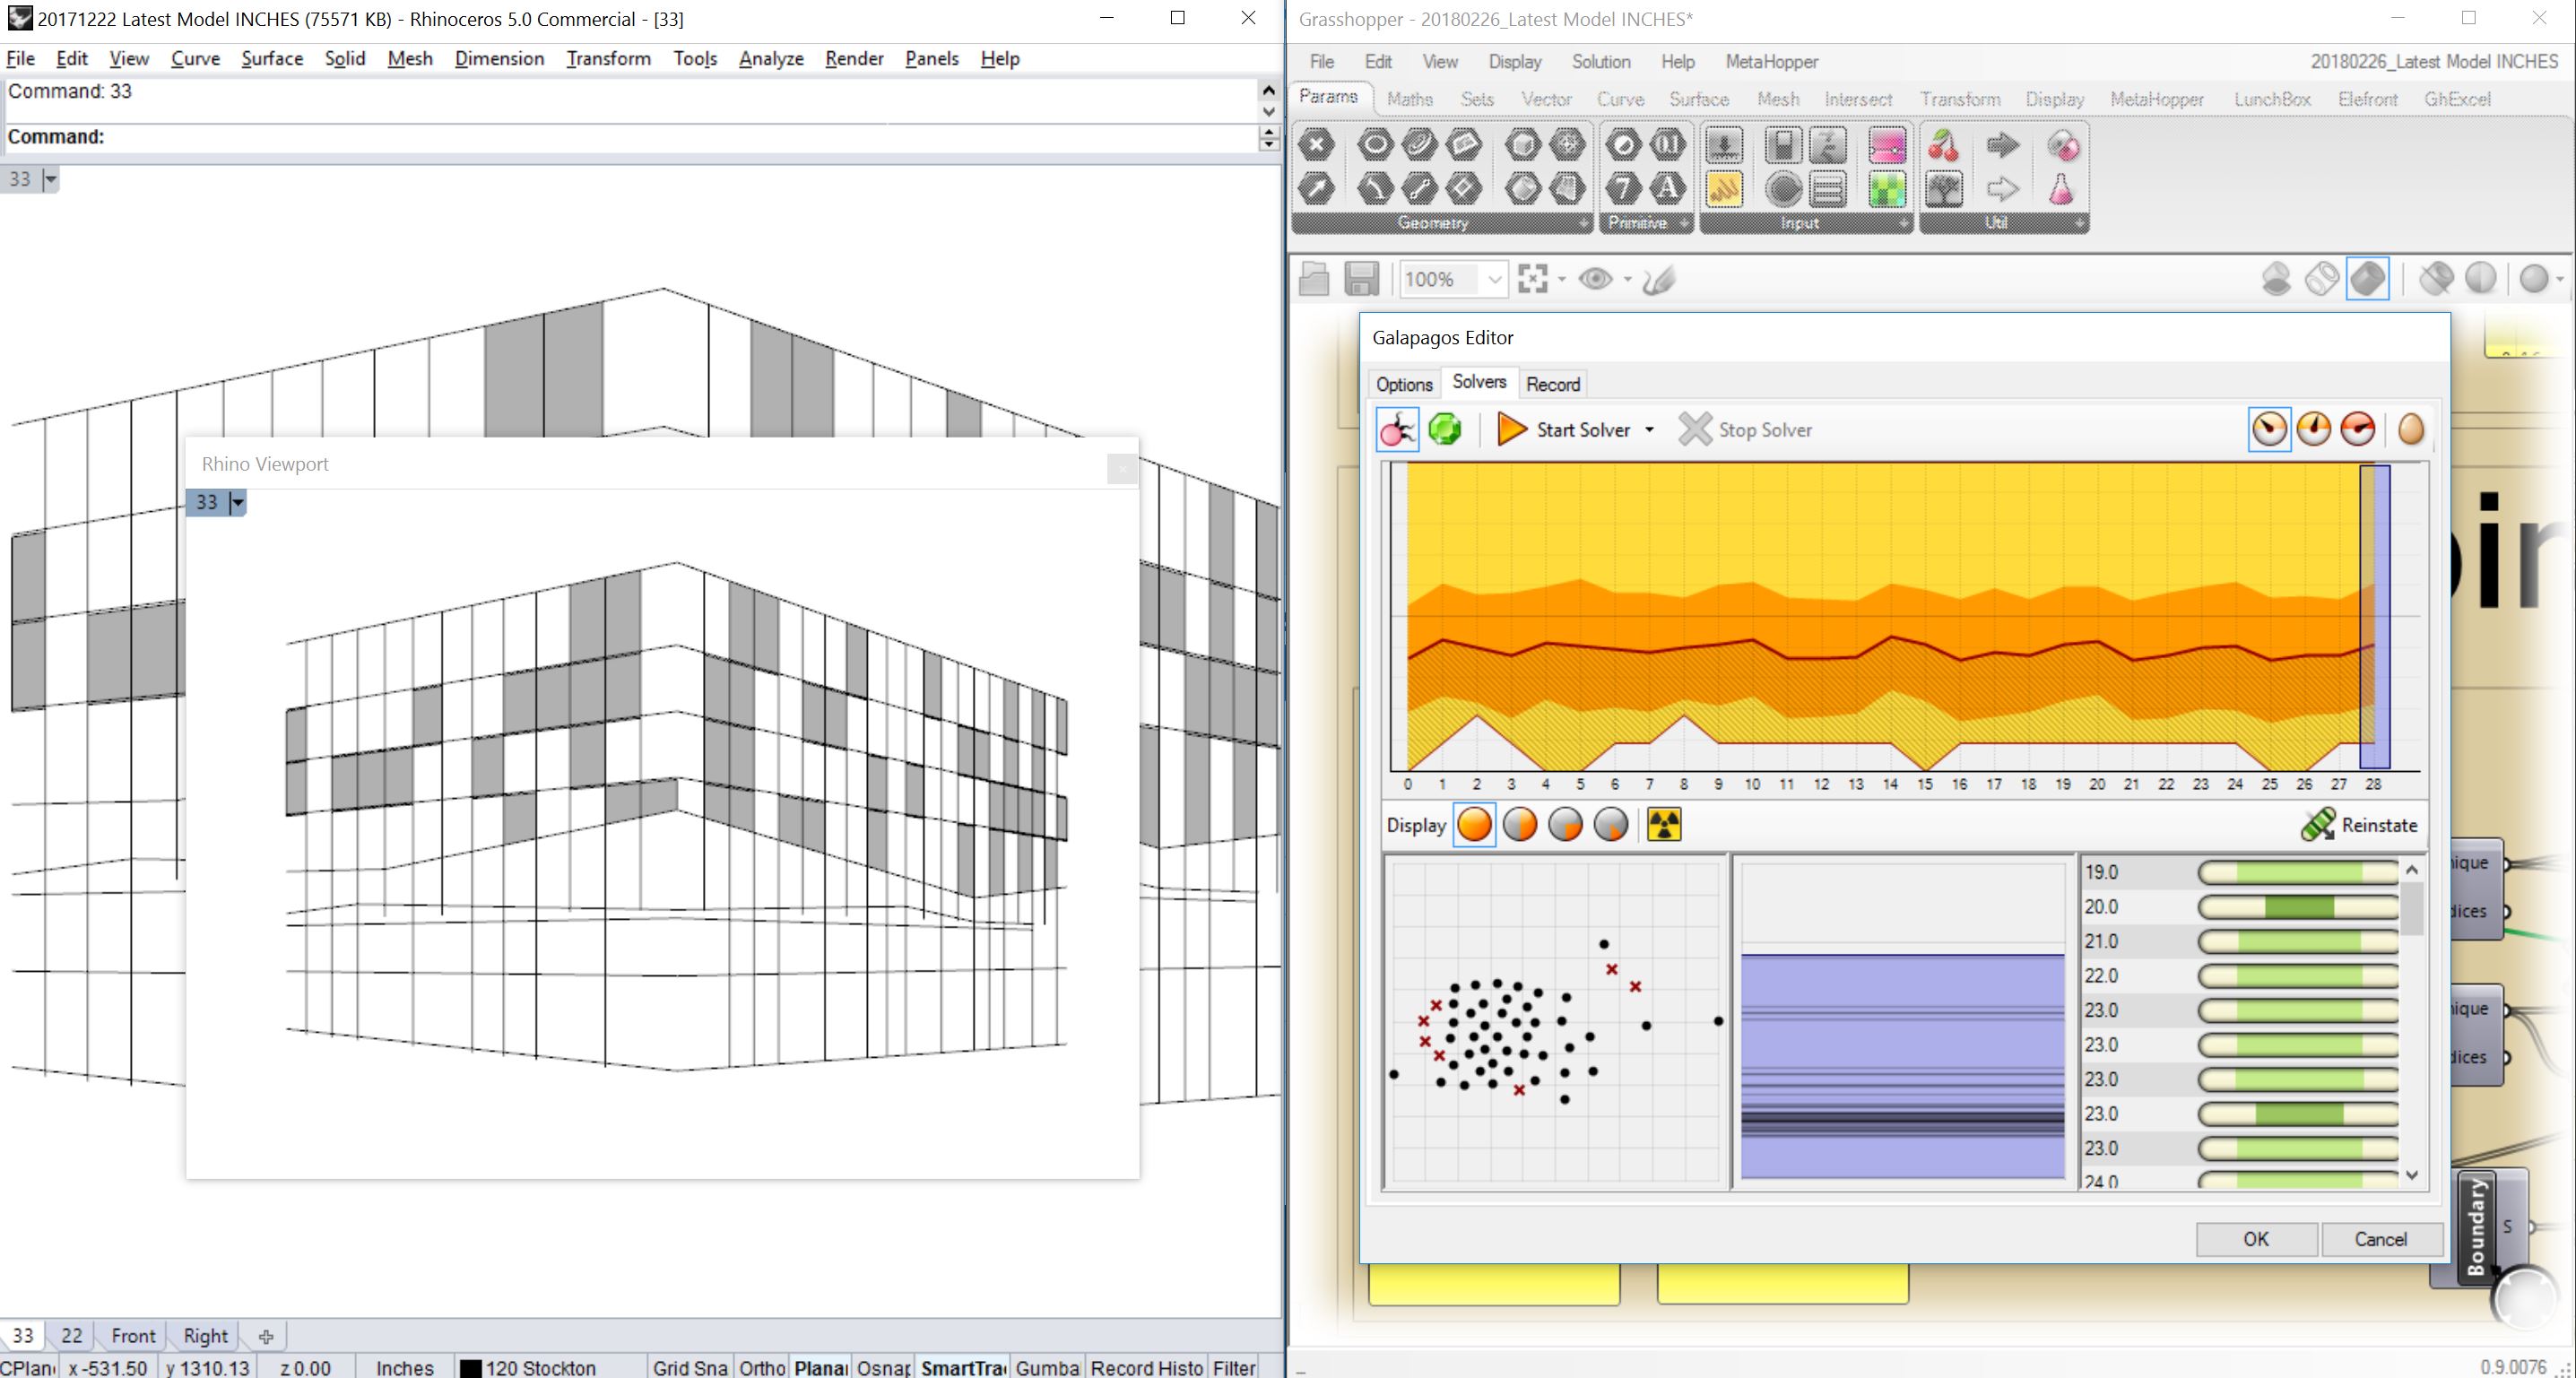 △Screenshots of Galapagos computing process.
https://vimeo.com/258177952
△The selection that achieves the goal was finalized in the facade pattern generation.
See more information of Galapagos:
http://www.grasshopper3d.com/group/galapagos
Dynamo-Revit
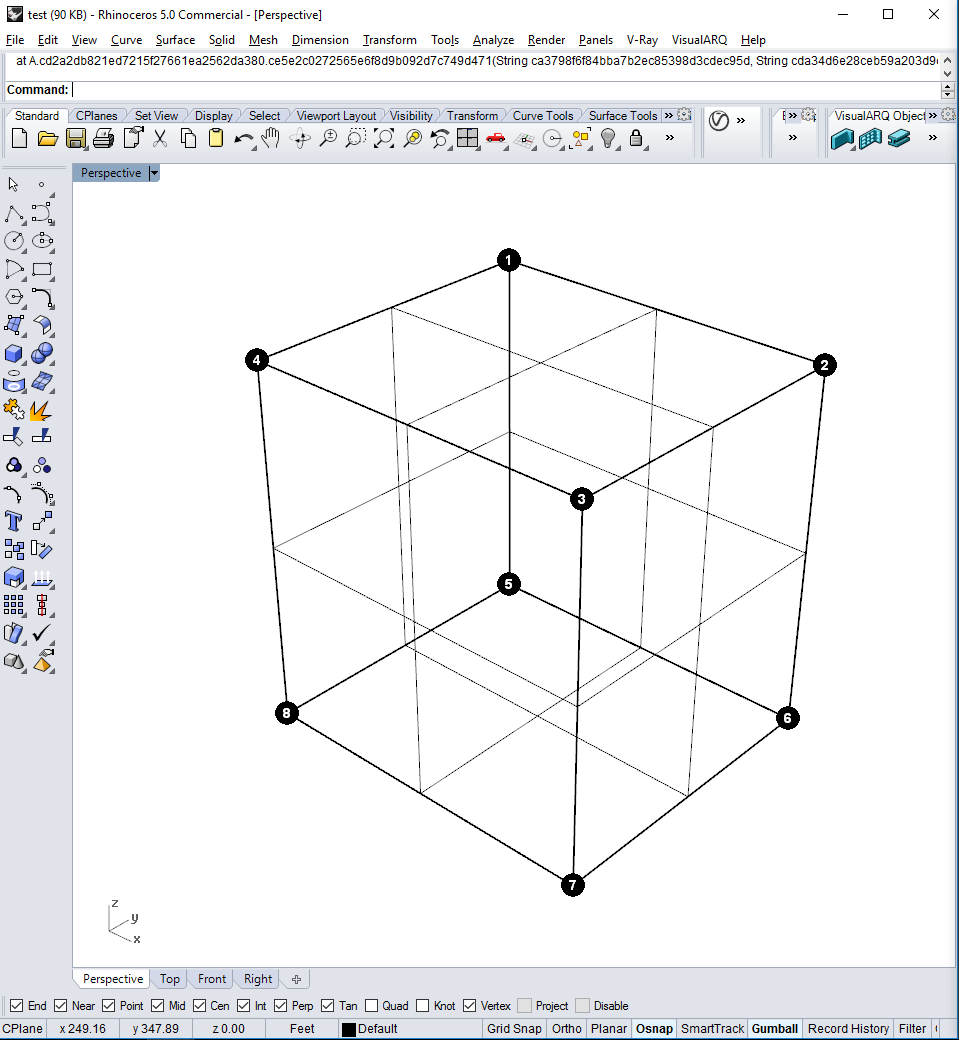
In order to explain the data flow Rh-Gh-Ex-Dy-(.rfa)-Rv, see the diagram above, we will look at a very simple example where we will show how to transport the dynamic data of a box, generated from 8 points.
Rhino:
Extract 8 points from your designed massing in concept phase, so that we could therefore rebuild a box with 8 points in revit.
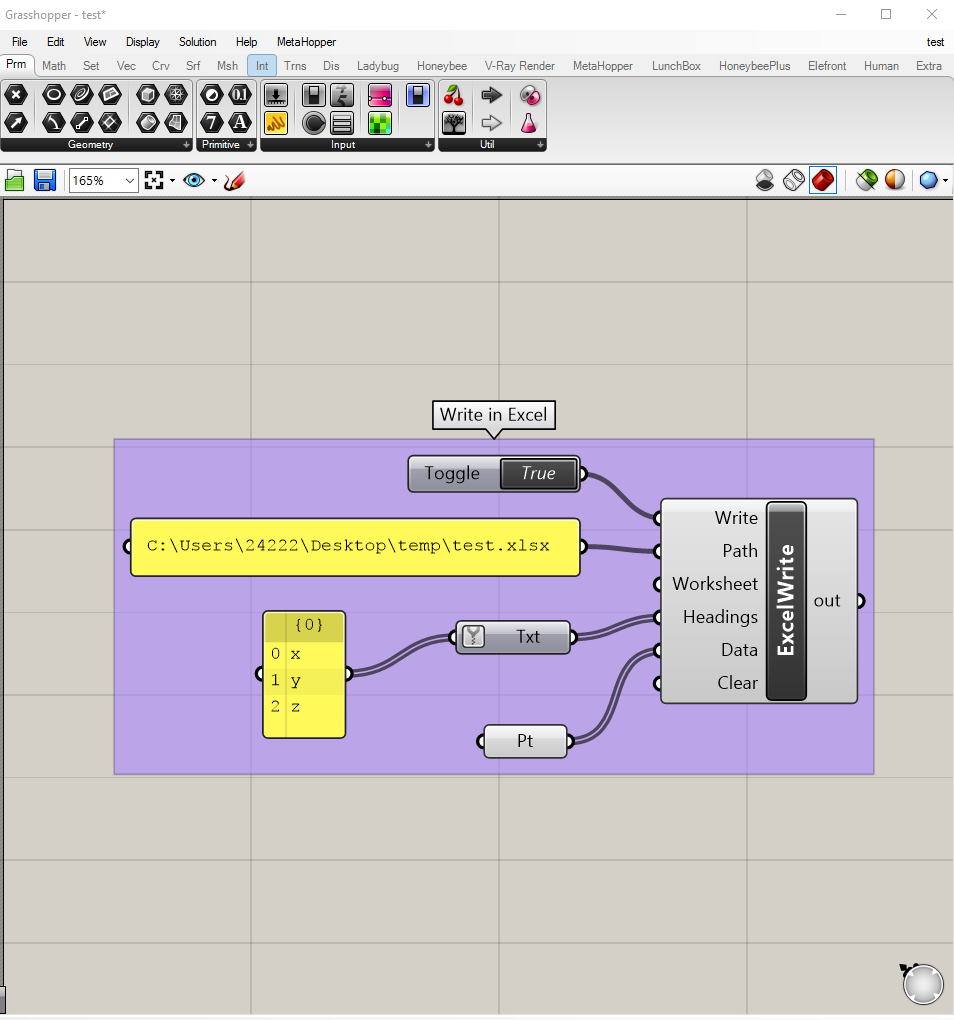
Grasshopper:
Transport the 8 points from rhino to excel via ![]() WriteExcel
WriteExcel
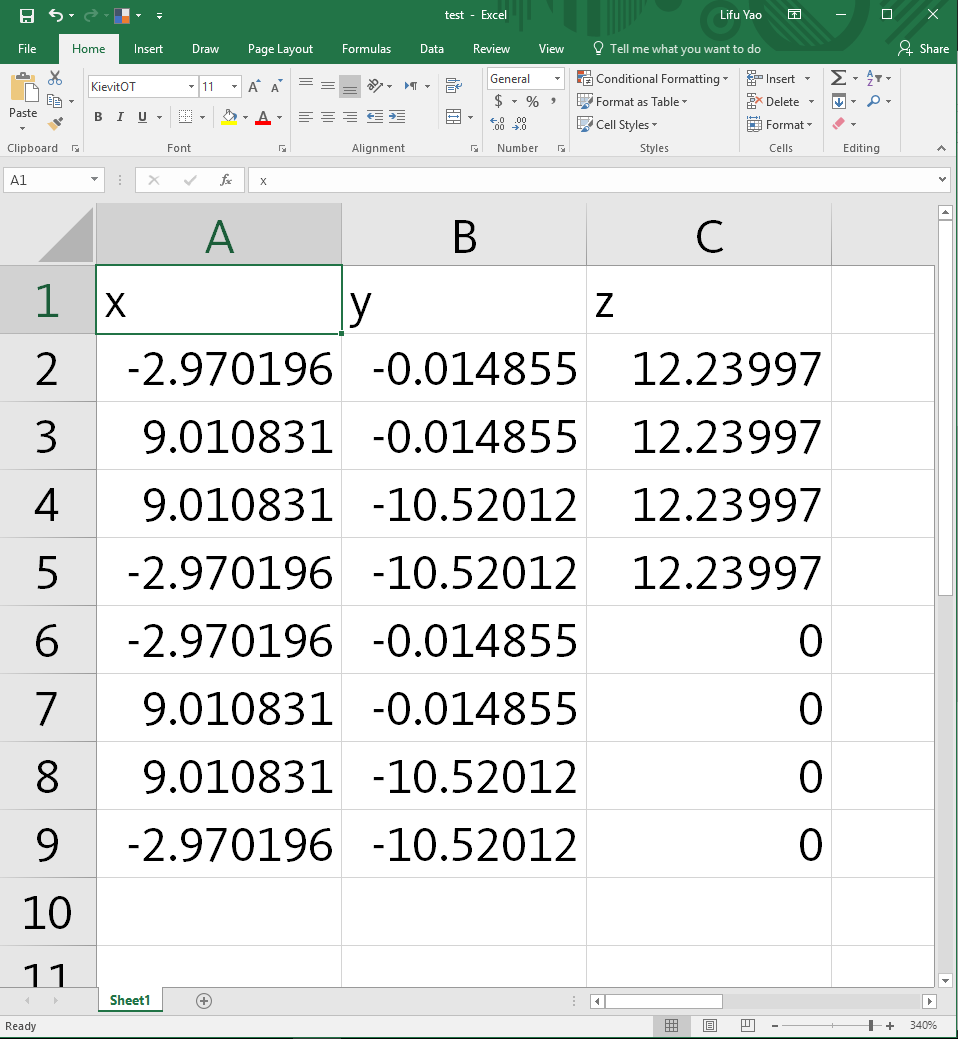
Excel:
The excel basically store only XYZ coordinates of points data.
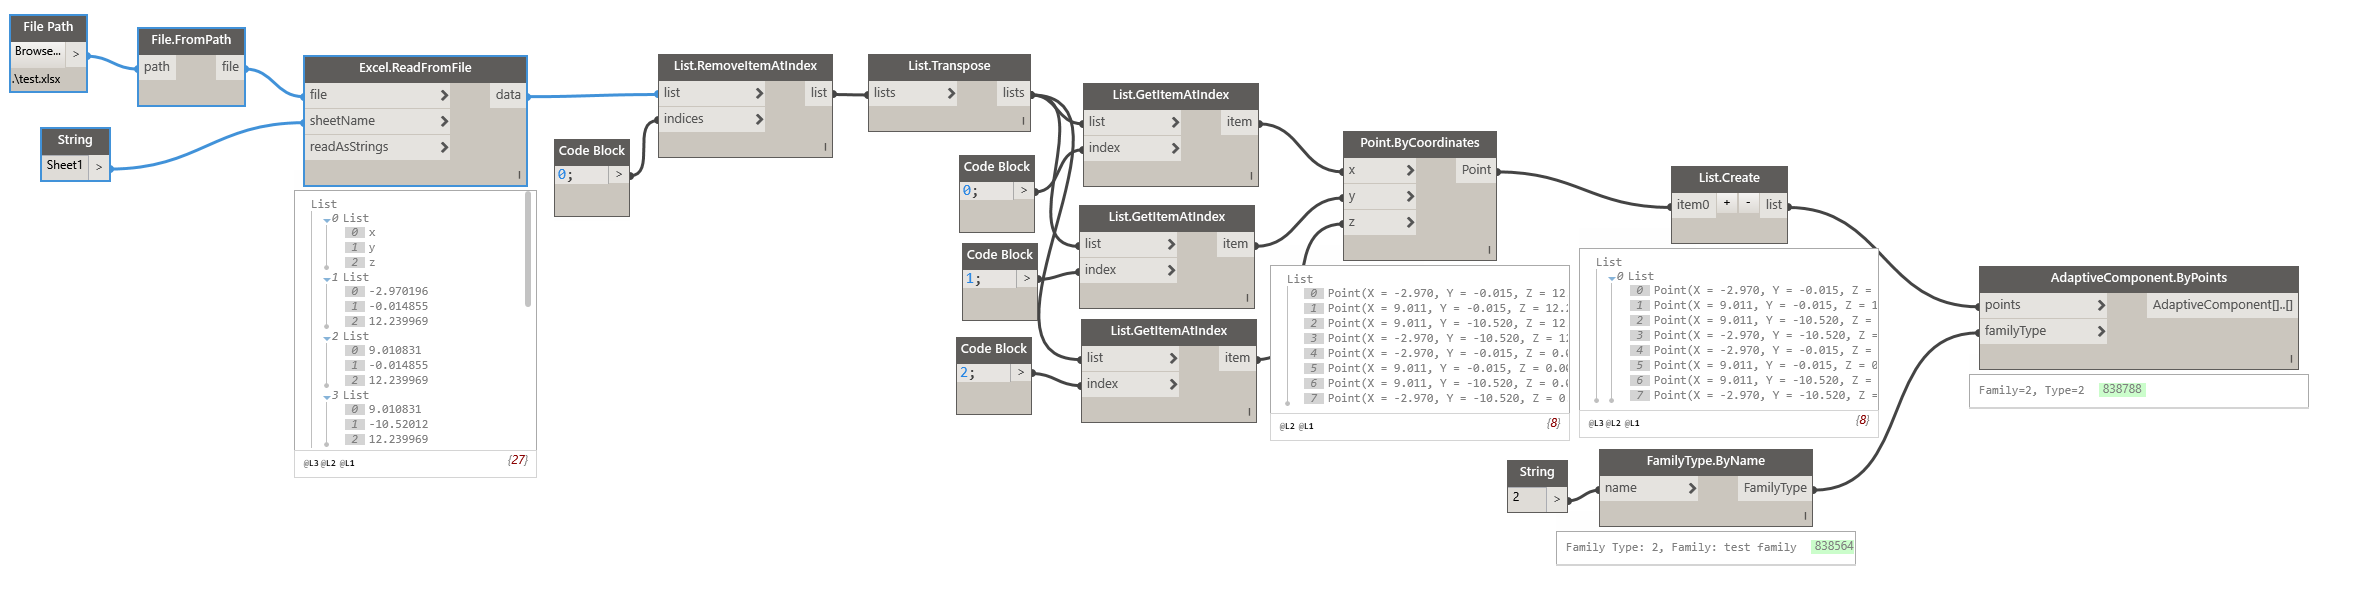
Dynamo:
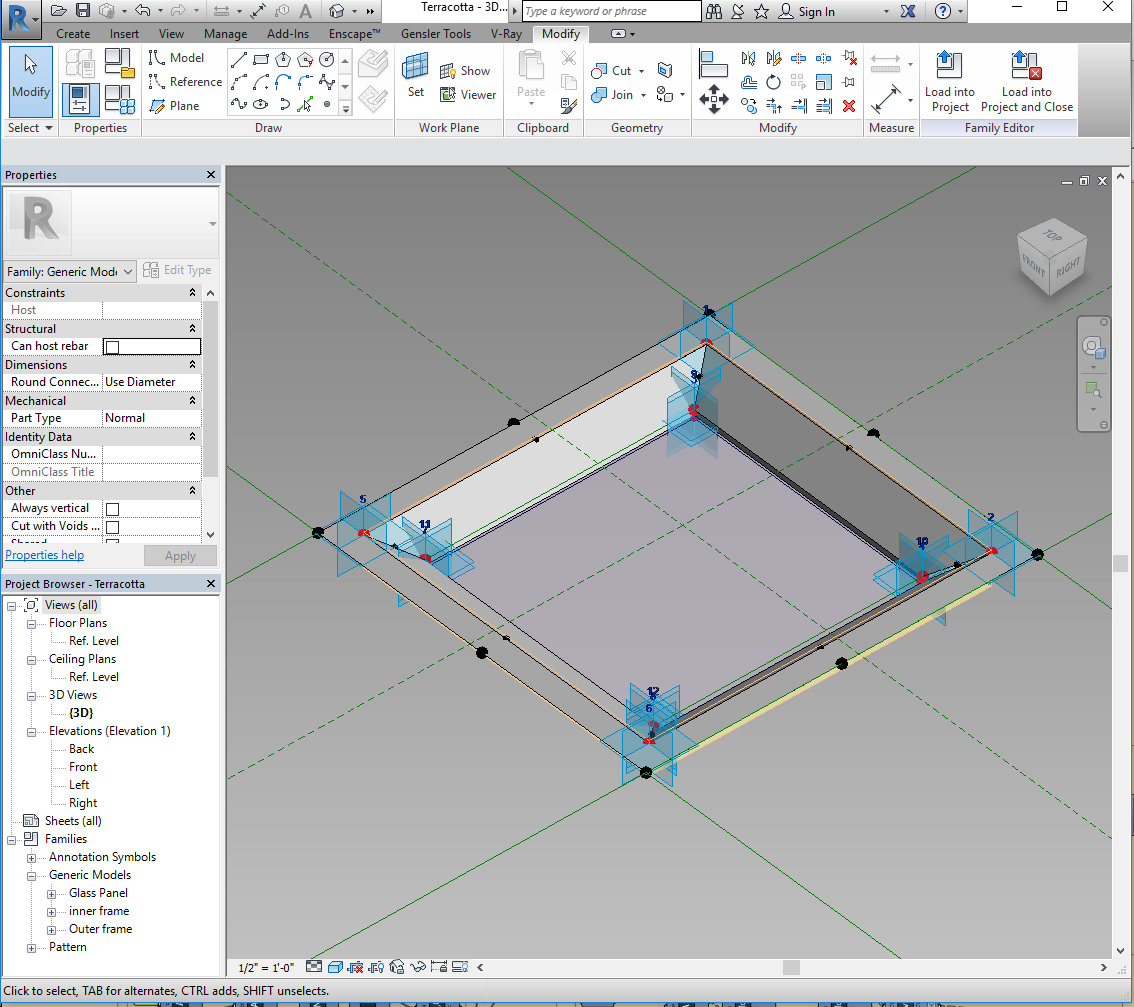
First read the excel file to collect the 8-Points data, then map the preset .rfa geometry on the Points.(refer the .rfa geometry to the next step.), using Adaptive-Components-by-Points
.rfa:
.rfa= family file that was preset defines how the generic model shall be generated from 8 Adaptive Points.
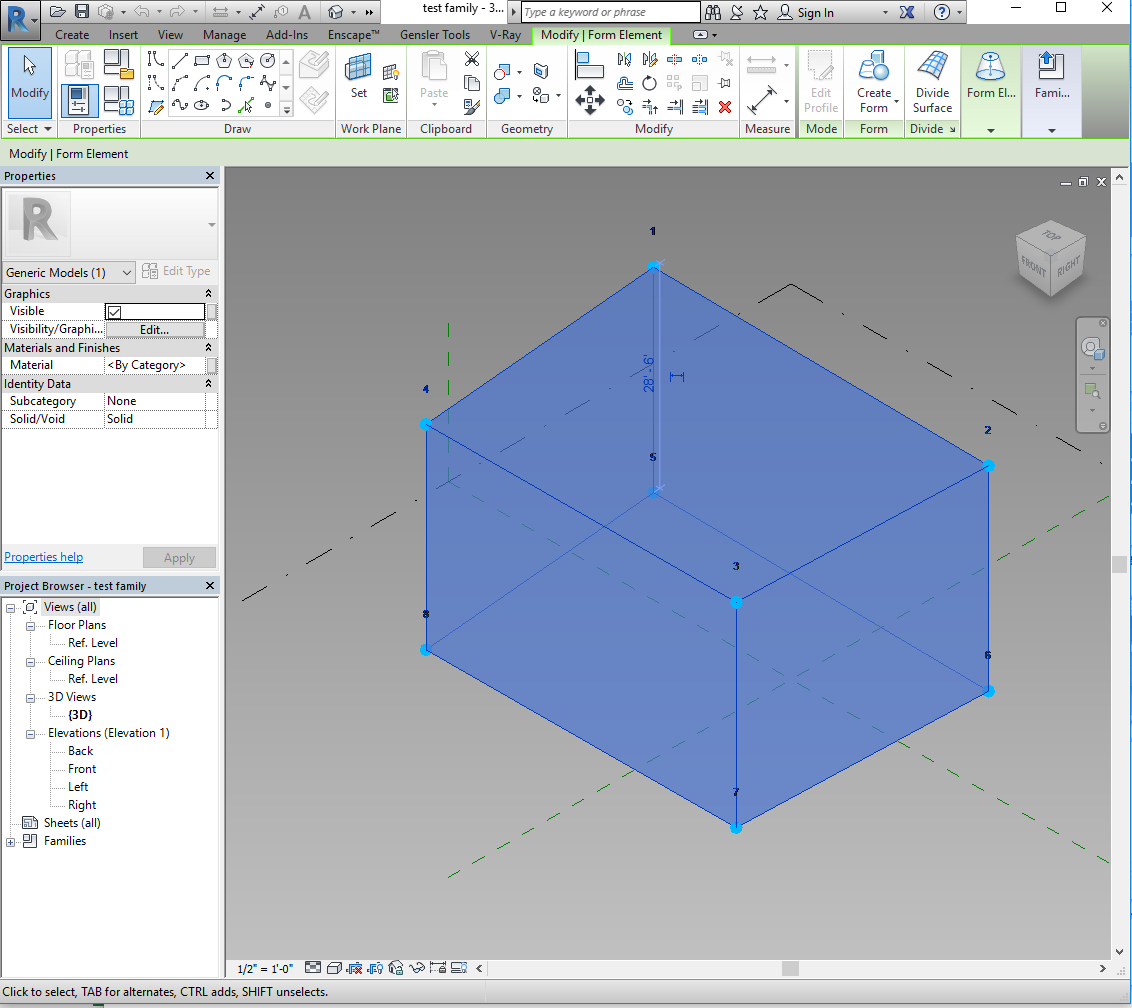
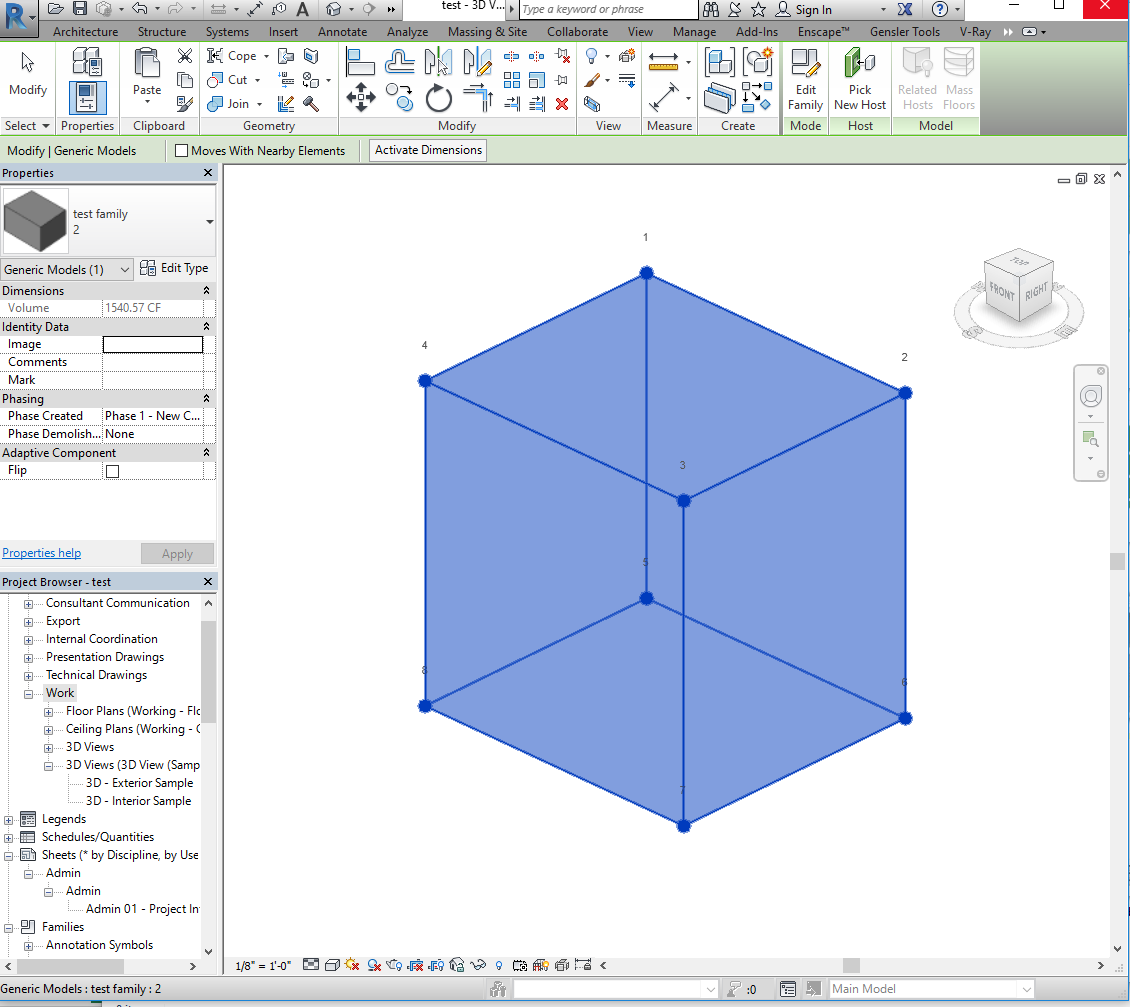
Revit:
One box now is built in revit workspace, and please note that it is a family contains a simple generic model box.
Example:
After the sample, we could go back to our example project where we wanted to map some different modules on the designed facade:
Rhino+Grasshopper:
.rfa:
Dynamo:

Revit:
Revit-one module:
Documentation:
Appendix
Rendering